Просмотр новости
Найдите то, что Вас интересует
 Спутники
 РН
РН SpaceX
 Роскосмос
 NASA
NASA
СпутникиРНSpaceXРоскосмосNASACompare the best container monitoring tools for Kubernetes and Docker. Learn features, use cases, and how to choose the right platform.
Every day, you check container metrics, review logs, monitor cluster health, and track alerts across different tools. Truthfully, switching between dashboards wastes time and increases the risk of missing crucial issues that could lead to a container incident.
You need a container monitoring tool that provides real-time insights in one place, simplifies troubleshooting, and reduces operational overhead.
This guide breaks down the best container monitoring tools in 2026, highlighting key features, who each tool works best for, and pricing.
| Tool | Best for | Stand-out feature | Price starting point | G2 rating | Capterra rating |
|---|---|---|---|---|---|
| Portainer | Unified container management with built-in operational visibility for enterprise DevOps teams | Unified management, access control, and workload visibility across multi-cluster environments | $9,995/year | 4.8/5 | 4.6/5 |
| Prometheus | Engineering-focused teams needing deep metrics | Highly customizable metrics collection | Free/open-source | 4.5/5 | 4.3/5 |
| Datadog | Teams wanting a quick SaaS deployment | Full-stack observability with AI-driven alerts | Usage-based, starts at $15/host/month | 4.4/5 | 4.6/5 |
| Sysdig Monitor | Security-conscious or regulated environments | Advanced container runtime monitoring and Kubernetes compliance | Enterprise pricing, based on nodes and features | 4.5/5 | - |
| New Relic | Large enterprises needing full-stack APM | AI-powered anomaly detection with SaaS observability | Free tier / usage-based for enterprise | 4.4/5 | 4.5/5 |
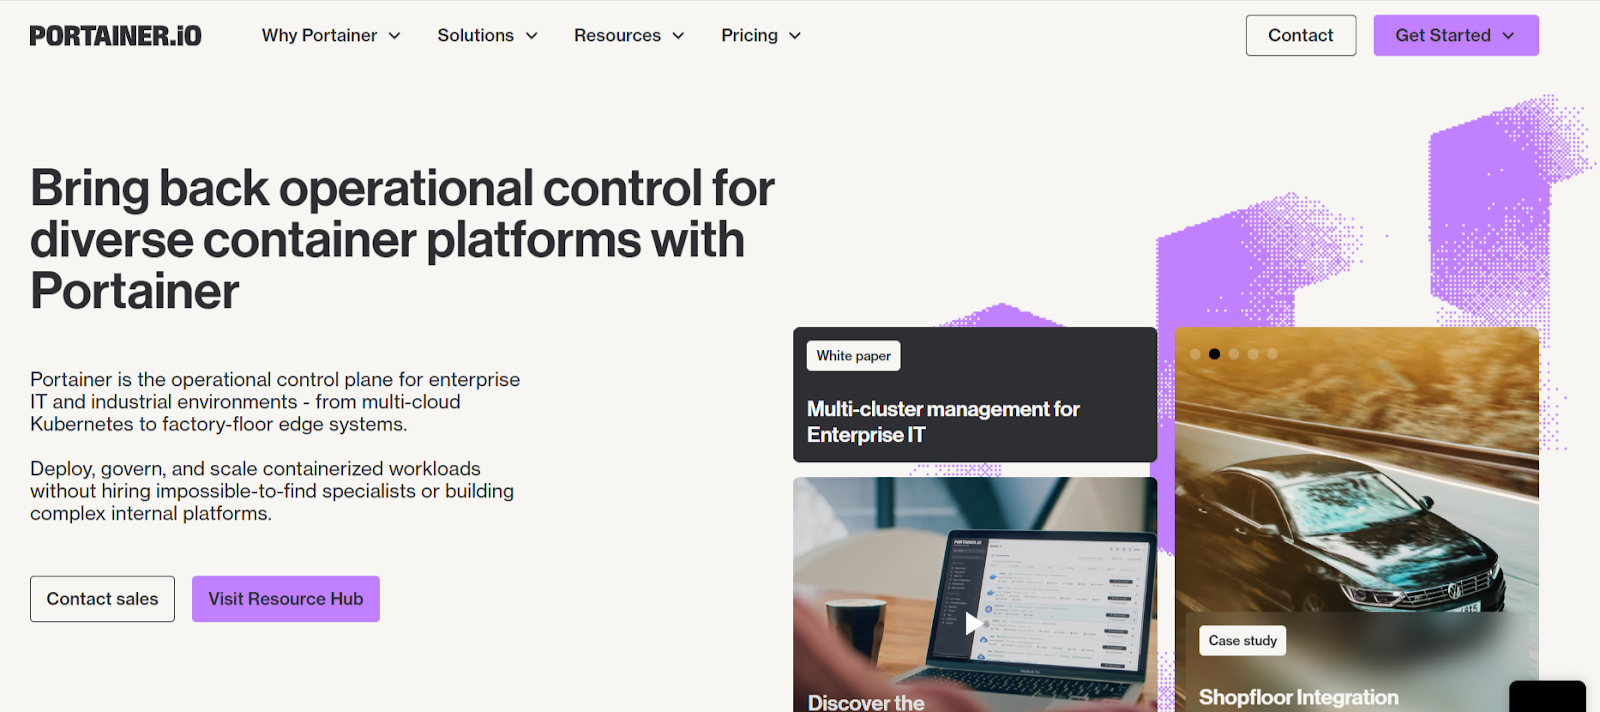
Portainer is a lightweight container management platform that runs as a single container and connects to your existing infrastructure. It provides a unified, secure way to manage your Docker and Kubernetes environments across on-prem, cloud, and edge.
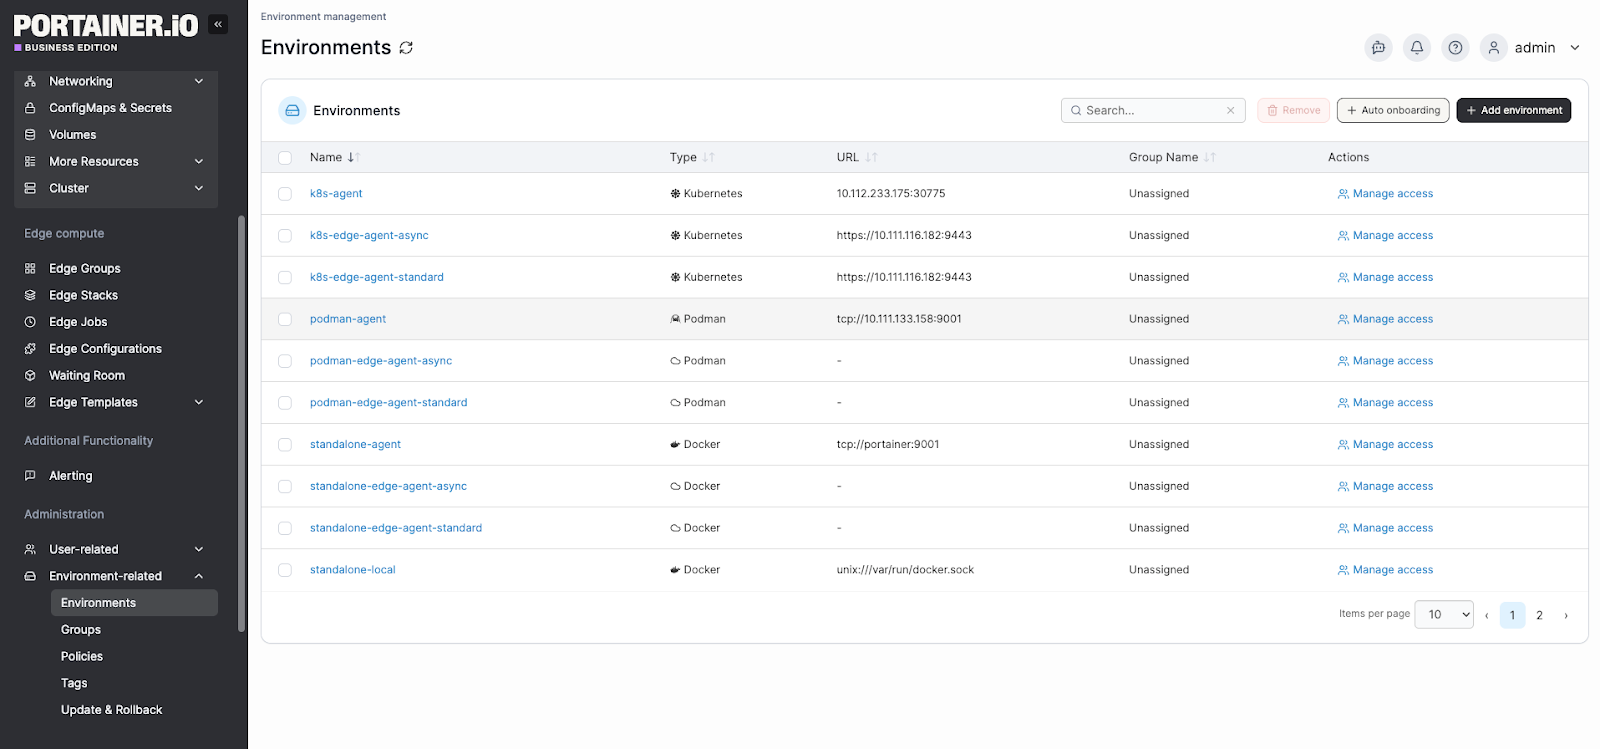
Unlike tools that focus solely on metrics, Portainer combines management, access control, and observability in one interface, without replacing CLI workflows or kubeconfig access. It also pairs naturally with dedicated observability tools like Prometheus or Datadog.
Key Features That Make Portainer DifferentBelow are three Portainer capabilities that matter most in real-world operation:
Centralized Multi-Cluster Visibility
Portainer integrates with Docker, Kubernetes, and edge clusters through a single interface.
Most importantly, it displays your cluster health, running workloads, namespaces, and resource consumption on a single dashboard. This reduces troubleshooting time because you can see the full environment in seconds, rather than jumping between tools.
Granular Role-Based Access Control (RBAC)
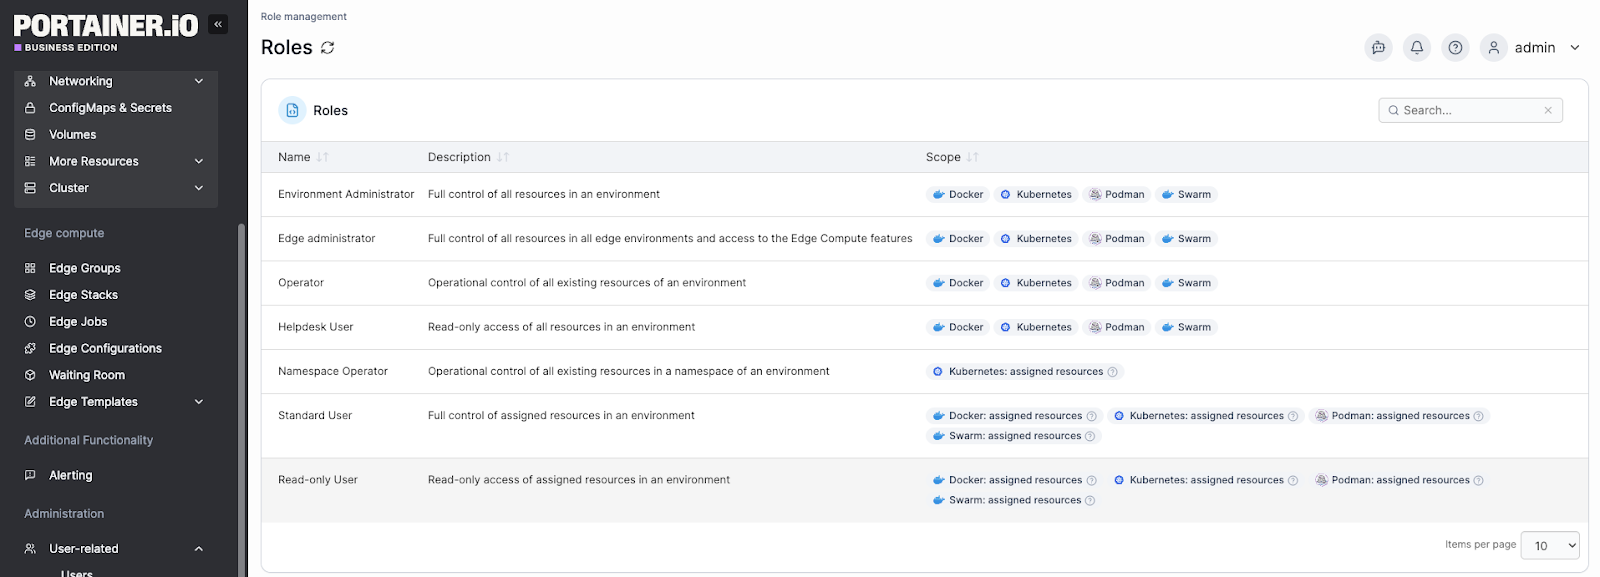
Portainer’s RBAC system allows admins to assign granular permissions across teams and environments. That means you can control who can deploy, modify, or view resources.
For organizations managing shared infrastructure, this makes it straightforward to enforce least-privilege access without custom scripting or external identity tooling. Teams that want to go further can also explore dedicated container security tools that work alongside Portainer for image scanning and runtime threat detection.
Live Container-Level Diagnostics for Faster Incident ResponseFrom within the Portainer UI, you can stream live container logs, filter output, and even open a direct console into any running container.
For instance, when a workload slows down, you do not need to switch to separate container-monitoring tools or SSH into the nodes. You identify the exact container causing resource pressure and take action immediately.
{{article-cta}}
Pricing| Plan | Description | Pricing |
|---|---|---|
| Enterprise | The plan comes with unified control across environments, built-in security, and 24/7 support | Starts at $9,995 yearly |
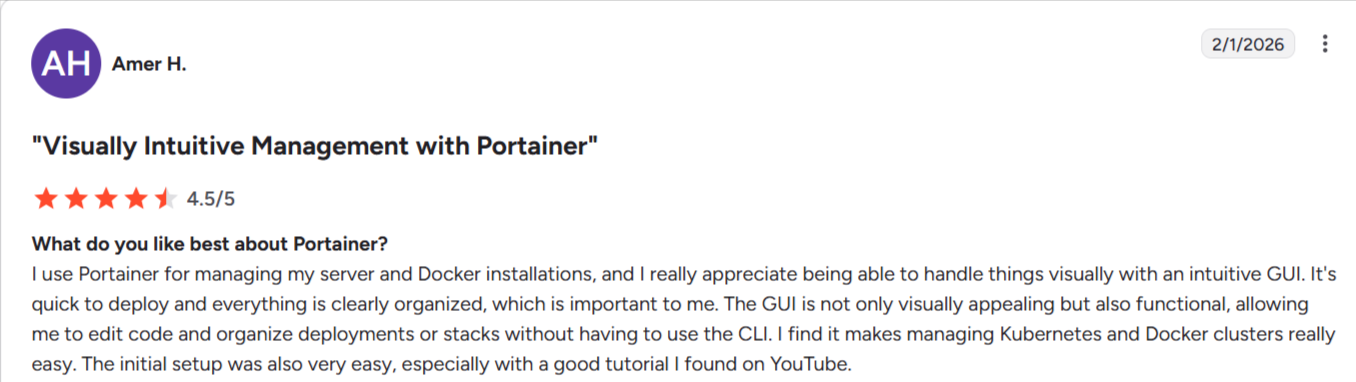
“A lightweight web solution was required to handle the management of our own development servers running in-house solutions internally. One such platform that caught my attention was Portainer, which is way easier to set up than Rancher for simple Docker Standalone or Swarm environments, giving immediate visibility into the health of your containers for your entire team.” Senior Software Engineer review on Capterra.
“Portainer makes monitoring and managing Docker containers and Docker Compose stacks MUCH easier. Re-creating Docker containers with small modifications from the original, without having to remember the exact command that started it in the first place, is a big productivity win.” Rudolf B.
Who Portainer Is Best ForContact our technical sales team now to empower your team with Portainer and efficiently monitor your containers.
Prometheus: Best for Deep, Metrics-Driven Container Monitoring
Prometheus is an open-source monitoring tool designed for dynamic environments such as Kubernetes. It focuses solely on collecting time-series metrics, alerting, and querying via PromQL.
Key FeaturesPrometheus is free and open-source software under the Apache-2.0 license.
| Plan | Cost | Notes |
|---|---|---|
| Open-source | Free | Self-hosted. Infrastructure and maintenance are handled internally |
Costs come from infrastructure, storage, and operational overhead.
Where Prometheus Shines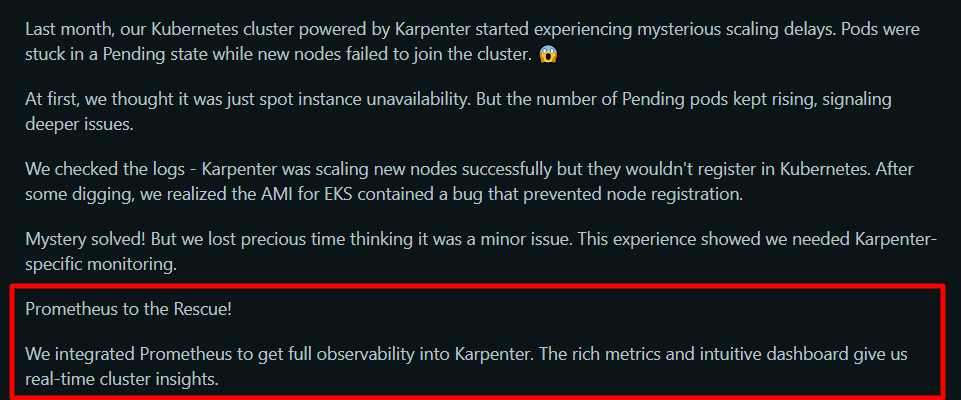

“Prometheus excels in real-time monitoring and alerting for cloud-native and containerized environments. It’s highly efficient, easy to deploy, and integrates smoothly with popular tools like Grafana and Kubernetes.” A G2 reviewer
“Learning curve can be a bit challenging for new users, especially around using promql and understanding the metrics. Also in very large environments, and with metric data that has too many dimensions, performance can sometimes be a bit not upto mark.” Ibrahim D.
Who Prometheus Is Best For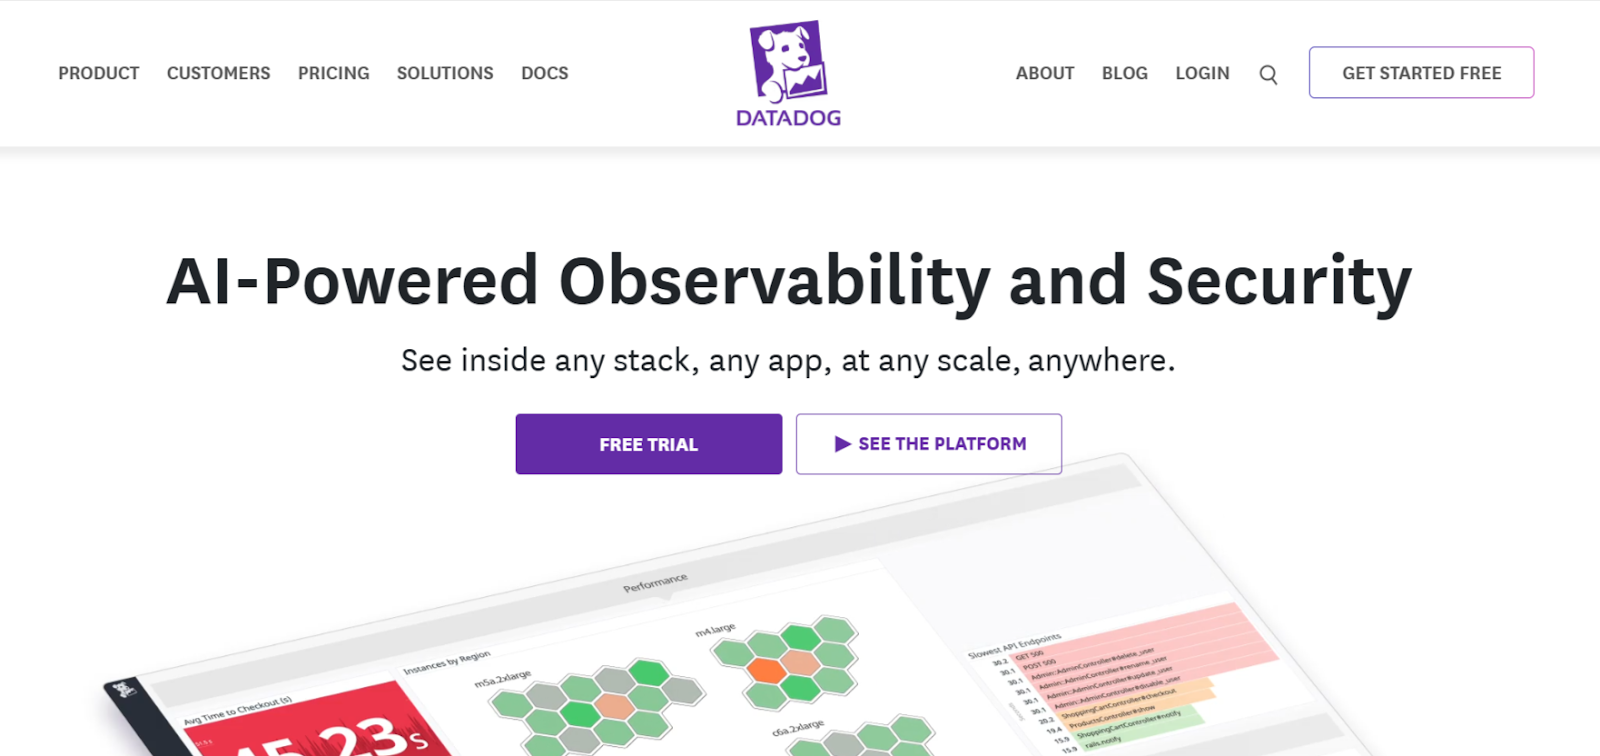
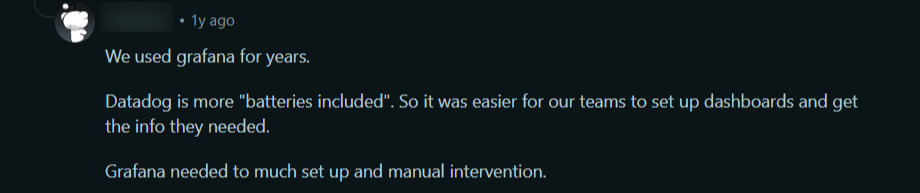
Datadog delivers deep visibility into Kubernetes and Docker without the need to build or maintain your own traditional monitoring stack. Unlike open-source container monitoring tools, it provides hosted storage, dashboards, anomaly detection, and alerting out of the box.
Key FeaturesDatadog uses modular pricing based on products and host/container count.
| Plan | Starting price | Note |
|---|---|---|
| Free | $0/month | Core collection and visualization features |
| Pro | $15/host/month | Centralize your monitoring of systems, services, and serverless functions |
| Enterprise | $23/host/month | Advanced features and administrative controls |
| DevSecOps pro | $22/host/month | Secure your cloud resources and adhere to industry standards |
| DevSecOps enterprise | $34/host/month | Advanced risk and threat detection capabilities |

{{article-cta}}
Customer Reviews“Datadog brings infrastructure, applications, logs, and security signals together in one place, which makes it much easier to understand what is really happening in an environment and to move quickly from detection to action. The correlation between metrics, traces, and logs is particularly valuable when diagnosing incidents, as it reduces guesswork and speeds up root cause analysis.” Gregory D.
“The biggest drawback is cost. Datadog becomes expensive very quickly—especially when log volumes grow or when you create many custom business metrics. Even with strict retention windows and log pipelines, the monthly bill requires constant governance.” Ajay V.
Who Datadog Is Best For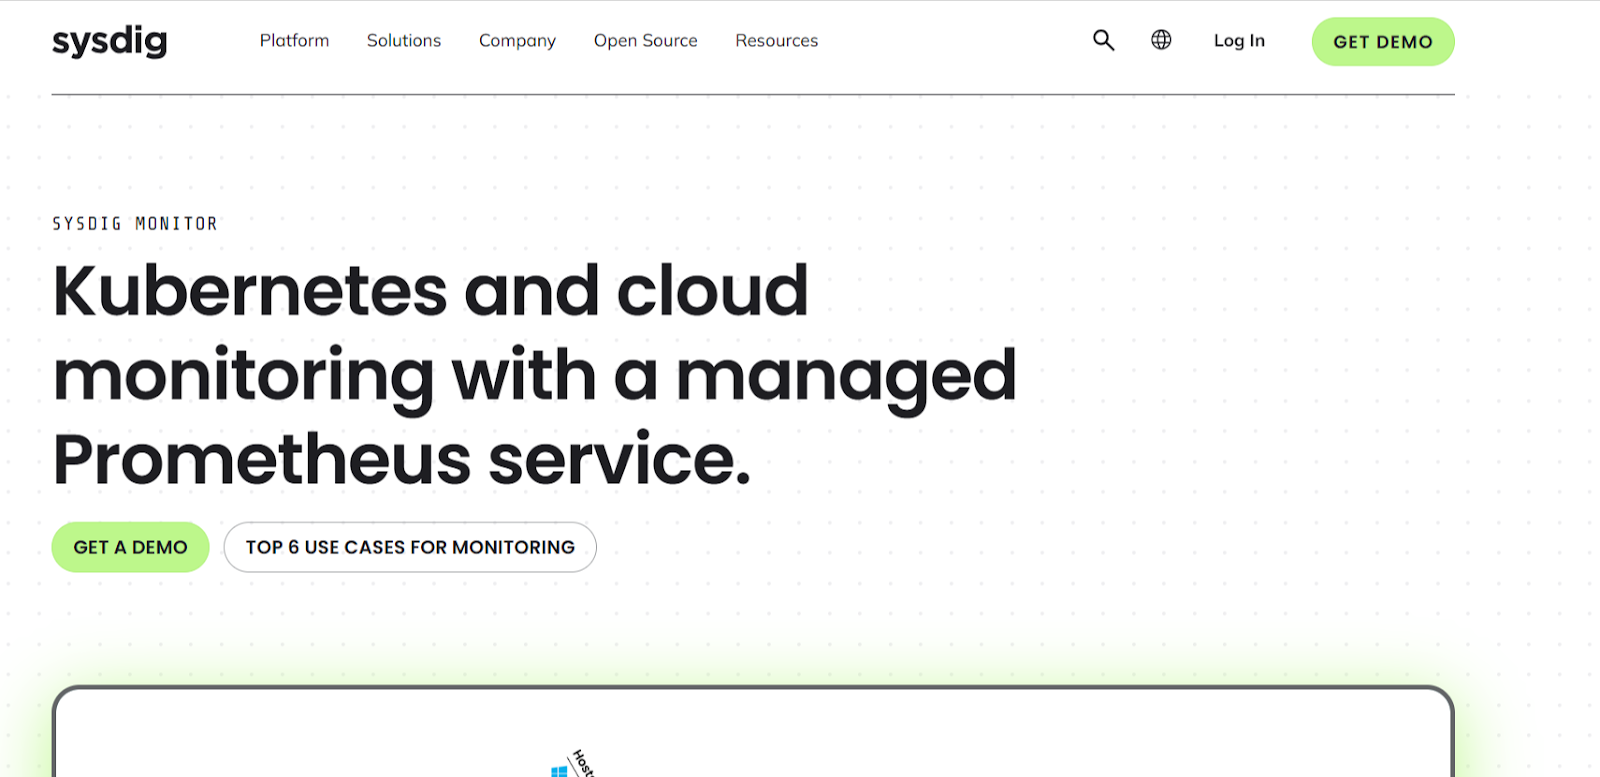
Sysdig Monitor focuses solely on infrastructure and container monitoring, without the heavier security modules found in Sysdig Secure. It delivers Kubernetes-native visibility, Prometheus compatibility, and detailed workload analytics.
Key Features

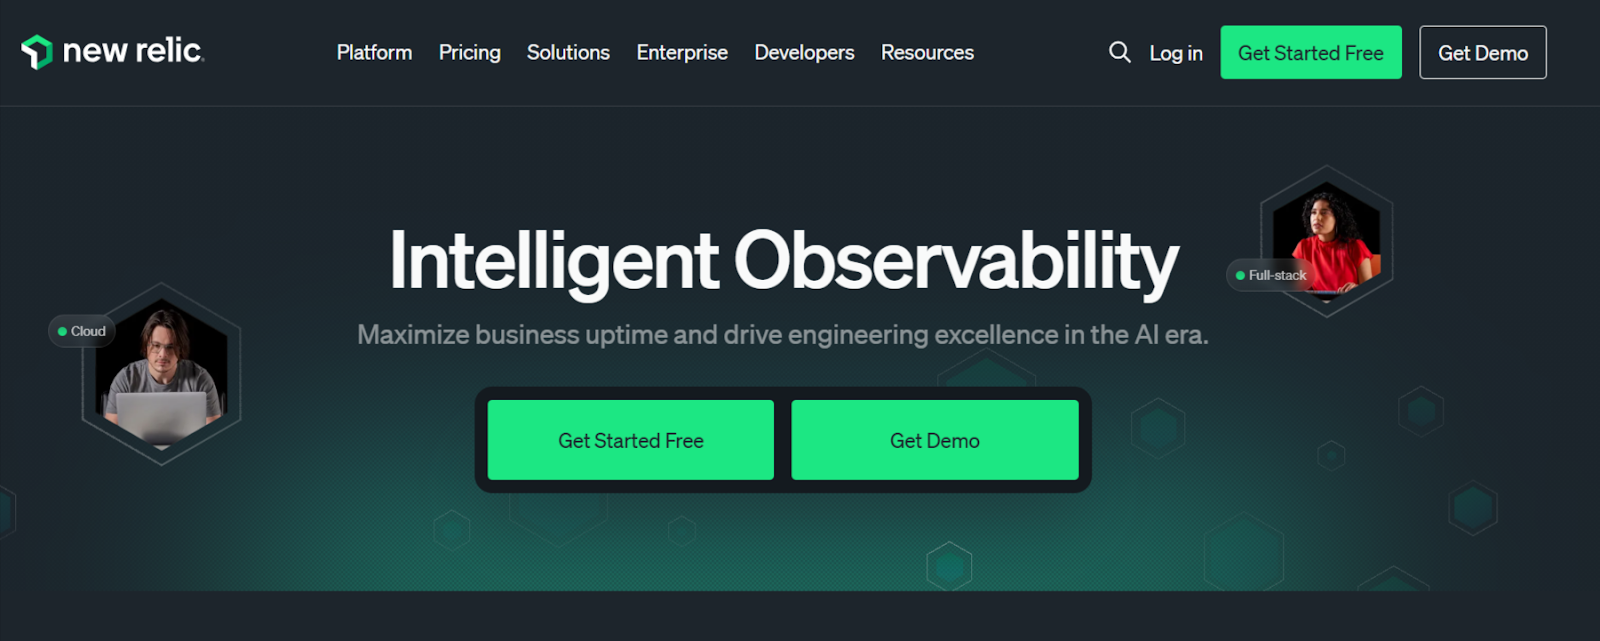
New Relic delivers an all-in-one observability platform covering infrastructure, applications, logs, browser performance, and distributed tracing.
Its key differentiator is deep APM combined with AI-powered anomaly detection, enterprise governance, and compliance features, all in a unified SaaS experience.
Key Features


You should consider visibility, control, cost predictability, and the operational burden your team can realistically manage when choosing a container monitoring tool.
Let’s break these points down properly:
Check Real-Time Container & Cluster VisibilityOftentimes, you don’t struggle with collecting container health metrics, but with turning them into practical answers that prevent incidents. That’s why you need a tool that provides:
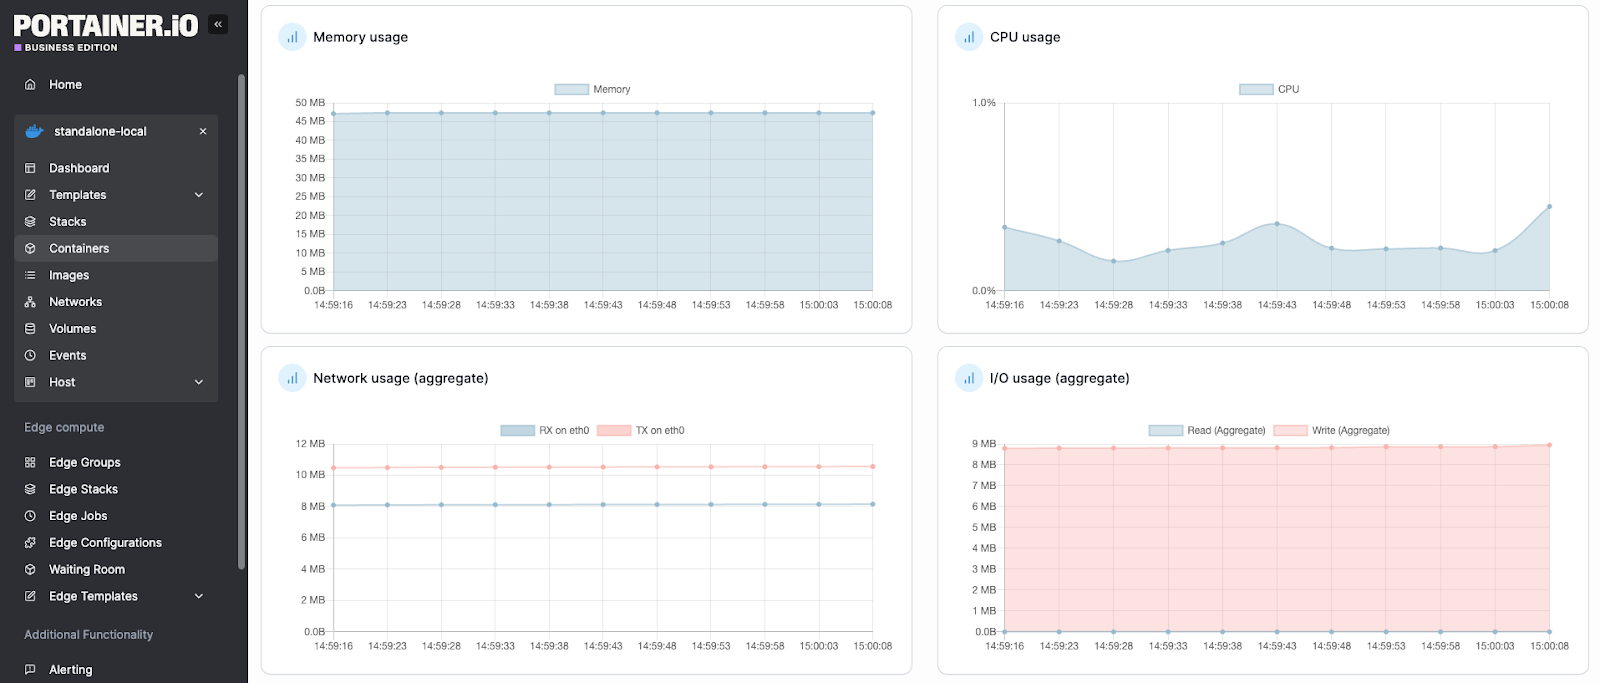
Portainer provides live container state, resource consumption graphs, and workload health directly in its UI, without requiring you to build dashboards first.
Book a demo to see how Portainer provides instant container-level visibility without building a monitoring stack from scratch.
Consider Operational Simplicity vs. Observability EngineeringSome platforms give you deep telemetry but require dedicated time to manage, tune, and scale them.
For instance, a common sentiment among DevOps teams and system administrators is that full observability stacks are powerful, but operationally demanding. Navigating the complexities of Kubernetes observability doesn't always require a heavy footprint, which is where Portainer's streamlined approach offers a middle ground.
Portainer doesn’t replace full observability stacks. Instead, it provides built-in container monitoring and health visibility within the same platform you already use for container management. That reduces context switching and infrastructure overhead.
Usage-based pricing models (common in SaaS observability platforms) often scale with log ingestion and metrics volume. Tools like Datadog and New Relic are known for scaling costs once clusters grow in production.
Before signing up for any platform, clarify:
Portainer bases its enterprise pricing on managed nodes rather than ingestion volume. That makes budgeting more predictable compared to data-volume-driven observability tools.
Consider Adoption by Your TeamThe most powerful container monitoring tool fails if your team avoids using it.
Get a tool with a clear UI, intuitive navigation, namespace and workload-level drill-down, and compatibility with kubectl and existing workflows.
Portainer supports kubeconfig and CLI workflows while offering a visual layer for faster inspection. That balance makes it easier for both experienced Kubernetes engineers and less specialized operators to work confidently.
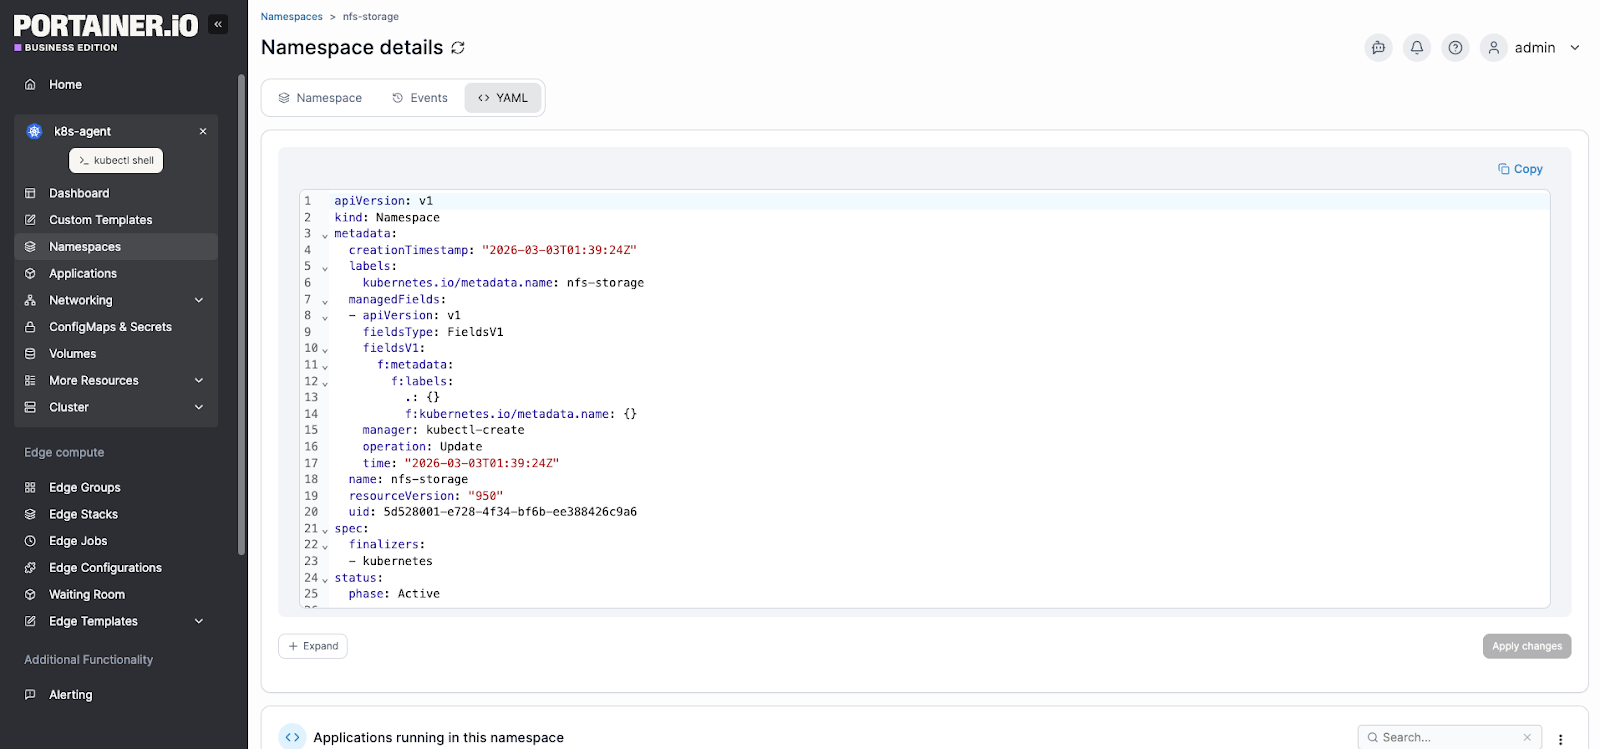
Choose Portainer Enterprise to monitor your containerized workloads without building complex internal platforms.
Manage and Monitor Your Containers More Efficiently with PortainerIf your team is tired of juggling Prometheus, Grafana, kubectl, and separate access controls just to understand cluster health, it’s time to change gears.
Portainer brings container monitoring and management into a single interface, without forcing you to rebuild your stack.
Book a demo to see how it gives enterprises multi-cluster control without tool sprawl.
Infrastructure Moves Fast. Stay Ahead.
Subscribe to our monthly newsletter| # | Наименование новости | Тональность | Информативность | Дата публикации |
|---|---|---|---|---|
| 1 | 7 Best Kubernetes Deployment Tools in 2026: In-Depth Review | 5 | 7 | 02-05-2026 |
| 2 | Docker Swarm vs Kubernetes: Which Should You Use in 2026? | 0 | 7 | 15-02-2026 |
| 3 | 6 Best Container Management Software & Platforms (2026 Reviewed) | 5 | 7 | 06-03-2026 |
| 4 | 7 Best Deployment Automation Tools in 2026: Ranked & Reviewed | 0 | 8 | 22-05-2026 |
| 5 | 5 Best Docker Swarm Alternatives & Why You Should Migrate | 0 | 5 | 11-04-2026 |
| 6 | 5 Best Kubernetes Security Tools in 2026: Full Breakdown | 0 | 5 | 06-05-2026 |
| 7 | 2026 Kubernetes Monitoring Guide: Challenges & Best Practices | 0 | 7 | 06-03-2026 |
| 8 | Choosing the best Kubernetes dashboard for your Enterprise | 0 | 5 | 08-01-2026 |
| 9 | 7 Best Kubernetes Managed Service Providers for 2026 | 0 | 7 | 17-03-2026 |
| 10 | 5 Best Industry 4.0 Tools for Smart Manufacturing (2026 Guide) | 5 | 7 | 08-04-2026 |