Просмотр новости
Найдите то, что Вас интересует
 Спутники
 РН
РН SpaceX
 Роскосмос
 NASA
NASA
СпутникиРНSpaceXРоскосмосNASAAbstract* With the advent of single-cell and spatial transcriptomics, many research groups are interested in identifying genes which are disproportionately expressed in the same cells at the same time. However, due to the sparsity of single cell data at the level of individual cells, this can be challenging. Here, we present scCoExpress: a Seurat-compatible R package that queries the co-expression intensity of gene pairs by scaling co-expression against a background distribution of similarly abundant gene-gene comparisons.

Lande K, Evensen KG and Williams AE. scCoExpress: A Sparsity-Aware R Package for Gene Co-Expression Analysis in Single-Cell Datasets [version 1; peer review: awaiting peer review]. F1000Research 2026, 15:1238 (https://doi.org/10.12688/f1000research.186153.1)
Software Tool Article
[version 1; peer review: awaiting peer review]
https://orcid.org/0009-0005-1613-8981
1,2, K Garrett Evensen1, April E Williamshttps://orcid.org/0000-0001-9281-8528
1https://orcid.org/0009-0005-1613-8981
1,2, K Garrett Evensen1, April E Williamshttps://orcid.org/0000-0001-9281-8528
11 Integrative Genomics Core, Salk Institute for Biological Studies, La Jolla, California, 92037, USA
2 Sanford Burnham Prebys Medical Discovery Institute, La Jolla, California, 92037, USA
Kathryn Lande
Roles: Conceptualization, Data Curation, Formal Analysis, Methodology, Software, Validation, Visualization, Writing – Original Draft Preparation, Writing – Review & Editing
K Garrett Evensen
Roles: Software, Validation, Writing – Review & Editing
April E Williams
Roles: Funding Acquisition, Project Administration, Resources, Supervision, Writing – Review & Editing
OPEN PEER REVIEW
REVIEWER STATUS AWAITING PEER REVIEW
With the advent of single-cell and spatial transcriptomics, many research groups are interested in identifying genes which are disproportionately expressed in the same cells at the same time. However, due to the sparsity of single cell data at the level of individual cells, this can be challenging. Here, we present scCoExpress: a Seurat-compatible R package that queries the co-expression intensity of gene pairs by scaling co-expression against a background distribution of similarly abundant gene-gene comparisons.
single-cell transcriptomics, spatial transcriptomics, R, Seurat, co-expression, co-localization
Corresponding author: Kathryn Lande Competing interests: No competing interests were disclosed.
Grant information: This work was supported by the The Razavi Newman Integrative Genomics and Bioinformatics Core Facility of the Salk Institute (RRID:SCR_014842 and SCR_014846) with funding from NIH-NCI CCSG P30 CA014195, NIH-NIA San Diego Nathan Shock Center P30 AG068635, the NIH-NIA Liver Cancer P01 AG073084-04, the Howard and Maryam Newman Family Foundation and the Helmsley Trust.
The funders had no role in study design, data collection and analysis, decision to publish, or preparation of the manuscript.
Copyright: © 2026 Lande K et al. This is an open access article distributed under the terms of the Creative Commons Attribution License, which permits unrestricted use, distribution, and reproduction in any medium, provided the original work is properly cited. How to cite: Lande K, Evensen KG and Williams AE. scCoExpress: A Sparsity-Aware R Package for Gene Co-Expression Analysis in Single-Cell Datasets [version 1; peer review: awaiting peer review]. F1000Research 2026, 15:1238 (https://doi.org/10.12688/f1000research.186153.1) First published: 27 Jul 2026, 15:1238 (https://doi.org/10.12688/f1000research.186153.1) Latest published: 27 Jul 2026, 15:1238 (https://doi.org/10.12688/f1000research.186153.1)
Identifying co-expressed gene pairs at the level of single cells is of high importance to many research programs, but due to the relatively low UMI count per cell, it can be difficult to identify whether a lack of co-expression in any given cell is caused by true non-expression, or by stochastic zero-inflation.
Many papers have previously analyzed co-expression at the single cell level through a variety of methodologies, including via simple Pearson correlation matrices.1 More advanced methods aim to deal with UMI sparsity by analyzing proportional abundances,2 or by estimating true expression levels with Poisson distributions.3 However, existing packages still struggle to assess co-expression between lowly expressed genes. Here, we provide a flexible solution for single-cell co-expression which performs strongly between low-abundance gene pairs, implemented as a Seurat-compatible4 R package.
Broadly, the scCoExpress algorithm works by modeling a series of pairwise null interaction strength distributions through permutations, and scaling the interaction strength of target gene pairs against a depth-appropriate background distribution. For example, the interaction strength of a pair of genes which are both expressed in roughly 10% of cells would be scaled against a null distribution of randomly selected gene pairs with abundances near 10%. This establishes a background rate at which random genes at a given pair of abundances co-express, and can be used to assess the degree to which a given gene pair co-localizes relative to chance at a particular sparsity level. Co-expression intensity for all gene comparisons, both the null and target comparisons, are quantified with a modified version of the Manders’ Overlap Coefficient5 originally developed for assessing fluorophore co-localization in confocal arrays:
MOC=∑k=1cAkBk(∑k=1cAk2)·(∑k=1cBk2)
Where c represents all cells in the experiment, A represents the vector of normalized expression of gene A in all cells k, and B represents the vector of normalized expression of gene B in all cells k. For each target gene comparison, a MOC Ratio is calculated as:
MOCRatio=MOCtargetsμ(MOCbackgound)
A Z-score is subsequently calculated for each comparison’s MOC against the null MOC distribution. In cases where many gene pairs are queried, the Z-score is adjusted to a predicted value (“ZAdj”) based on the linear regression of all Z-scores against the raw MOC ratio, in order to reduce noise. Finally, p-values are quantified from Zadj using a standard normal table.
Background MOC distributions are tabulated in one of two ways depending on the user’s settings. The default and recommended way is via “partitions,” wherein all genes in the input are grouped into N equally-sized groups based on the fraction of cells in which each gene is detected, excluding genes with expression extremely close to or equal to either 0% or 100%. One background distribution is then calculated for each pairwise comparison of partitions, and target gene pairs are subsequently normalized against the most appropriate null set. Users also have an option to run scCoExpress in “local” mode, wherein an independent null distribution is generated for each target gene set based on the genes with the closest expression to both targets. Local mode offers improved resolution in many cases, but is substantially less memory efficient when querying a large number of gene pairs
scCoExpress is currently available for download on Github. It is a simple and user-friendly R package, which in its most minimal form can be run with a single command, and then visualized with a single subsequent command. The only required inputs are a Seurat object with a normalized assay slot, and a vector of genes:
# Install and load libraries
remotes::install_github("katlande/scCoExpress")
library(Seurat)
library(ggplot2)
library(scCoExpress)
# Run co-expression with default settings, returns a data.frame:
co <- CoExpress(obj = pbmc, target_genes = c("gene1", "gene2", "genen"))
# Visualize co-expression as a correlation plot, returns a grob:
plotCoExpr(co)
scCoExpress will query co-expression across all cells in the supplied Seurat object. To restrict the analysis to a specific cell type or variable(s), one must subset the input object as desired prior to running CoExpress(). A full vignette going over input parameters and QC has been provided on GitHub.
To assess scCoExpress’s ability to identify co-expressed genes across tissues, SMART-Seq and 10x 3′ GEX data from all organs available in the Tabula Muris6 mouse single cell atlas were queried. For each tissue, a distinct set of genes expected to show a high degree of co-expression clustering were identified by running Seurat4 v5.0.1.9001’s FindAllMarkers() between all annotated cell types. The top 10 cluster-specific genes for each cell type were identified as genes with an adjusted p-value <0.05 and the highest average log2foldchange between the cluster and background cells. Co-expression was subsequently queried on each marker gene list in its respective tissue, using the default settings of scCoExpress.
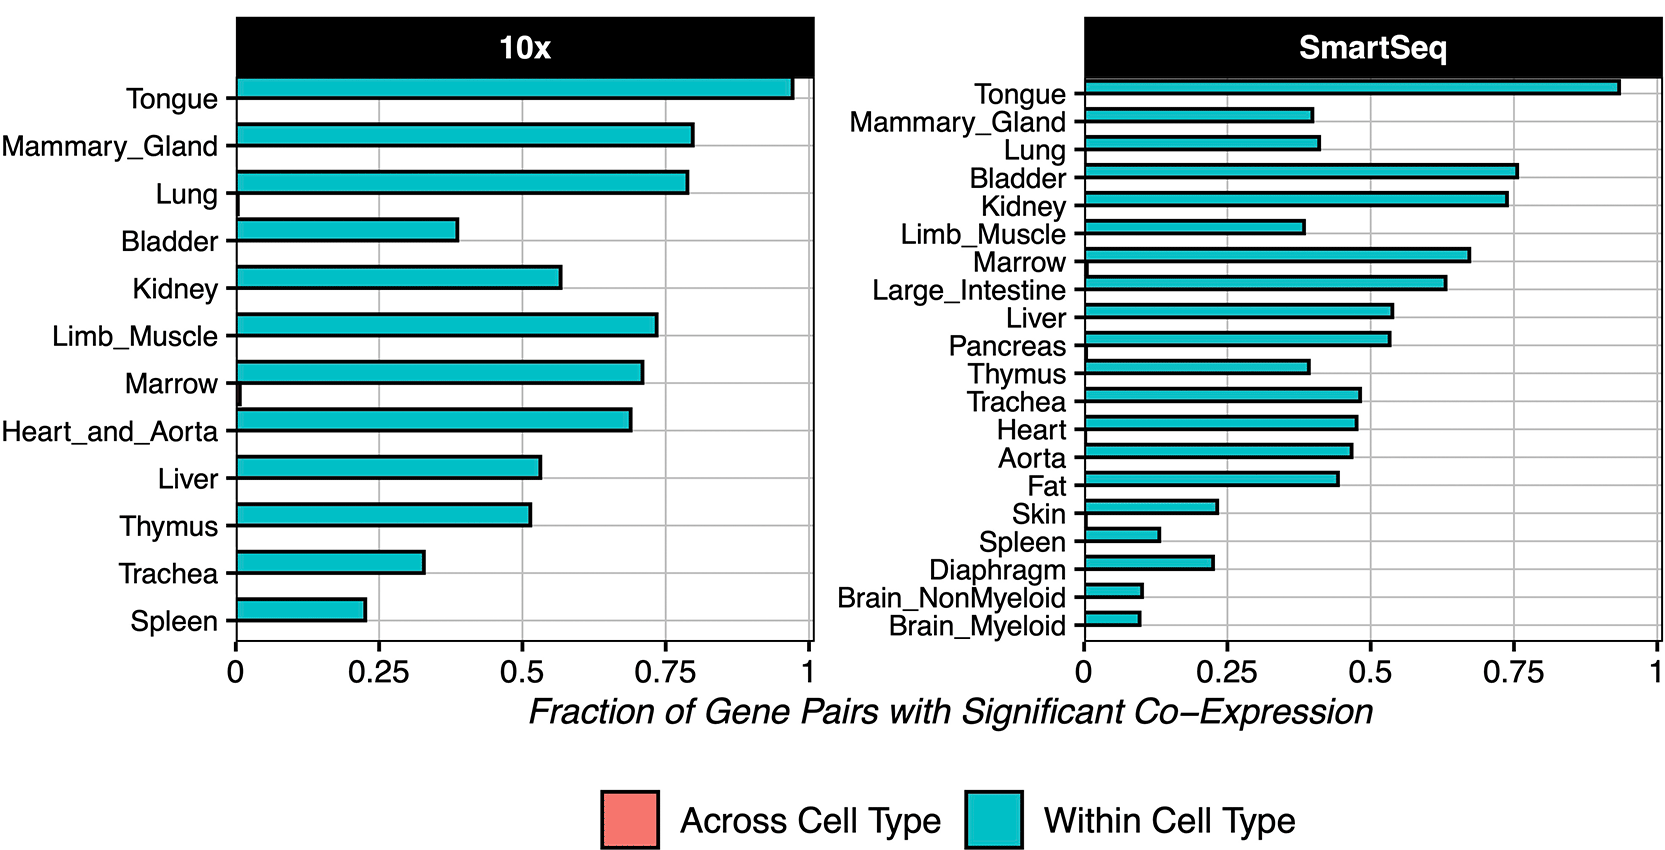
In both the SMART-Seq and the 10x 3′ GEX data, scCoExpress was able to identify high levels of significant co-expression within, but not between, cell types from all tissues ( Figure 1, Extended Data 1, Figure 2).
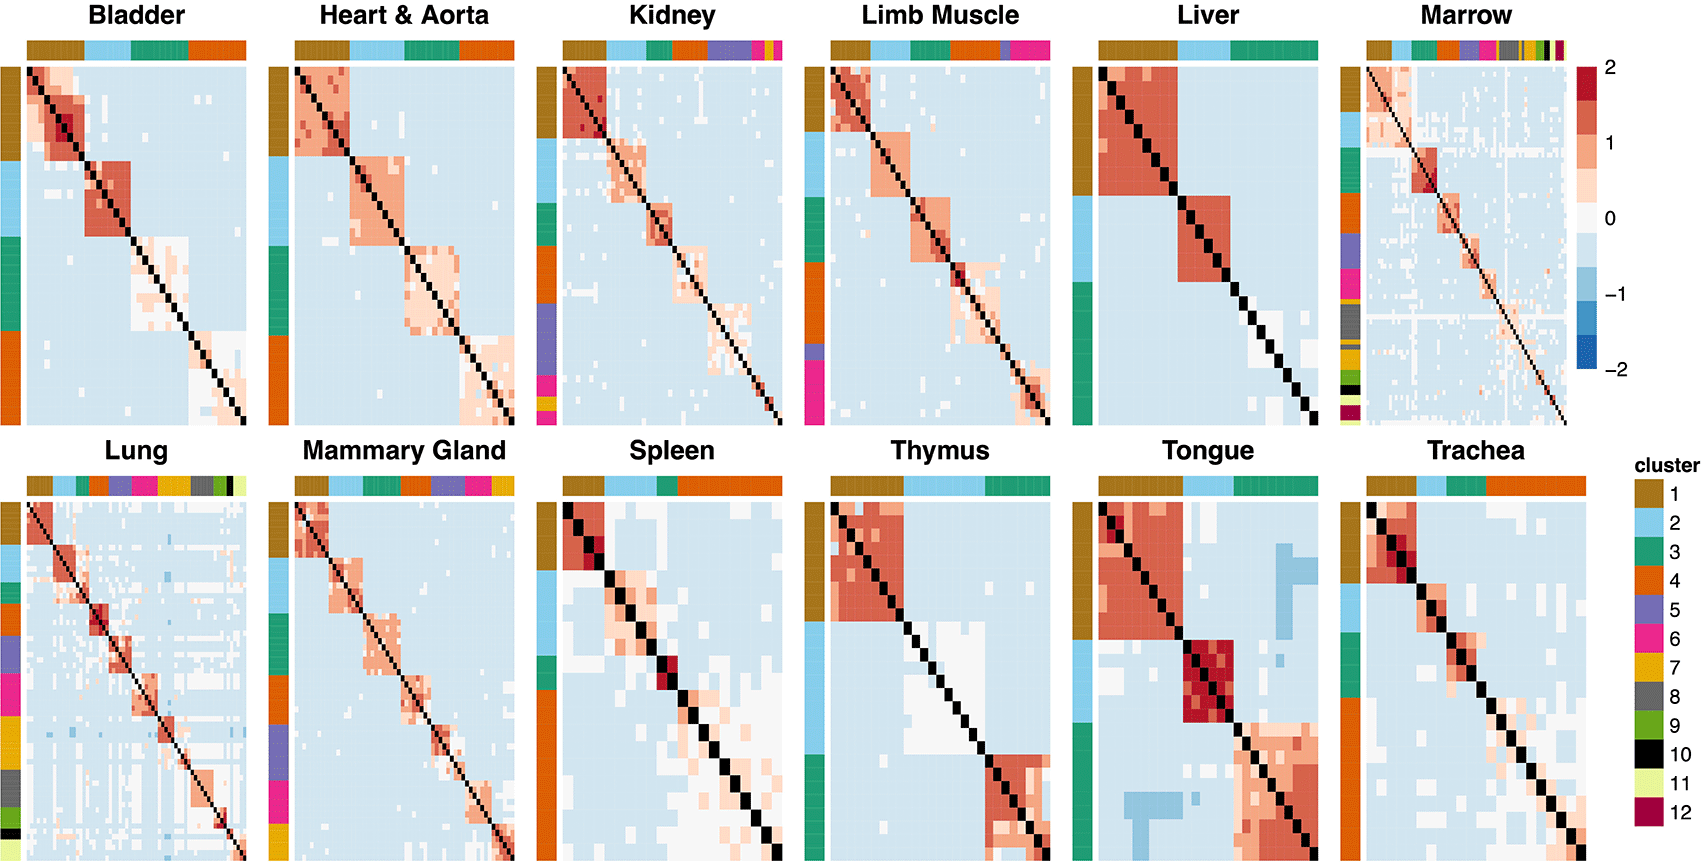
Numeric clusters identify origin cell type of each marker gene.
Additionally, when we assess co-expression results by the sparsity of the input gene pairs, we see that scCoExpress is capable of identifying significant co-expression even when it occurs between two lowly-abundant genes ( Figure 3). Further, when assessing whether low abundance gene pairs (where both genes are expressed in <5% of cells) are depleted from the significantly co-expressed set, we find the inverse. Low-abundance pairs show an enrichment in the significant pair set over the NS pair set via Fisher’s Exact Test: enrichment ratio = 1.34, p = 3.72 × 10−07.
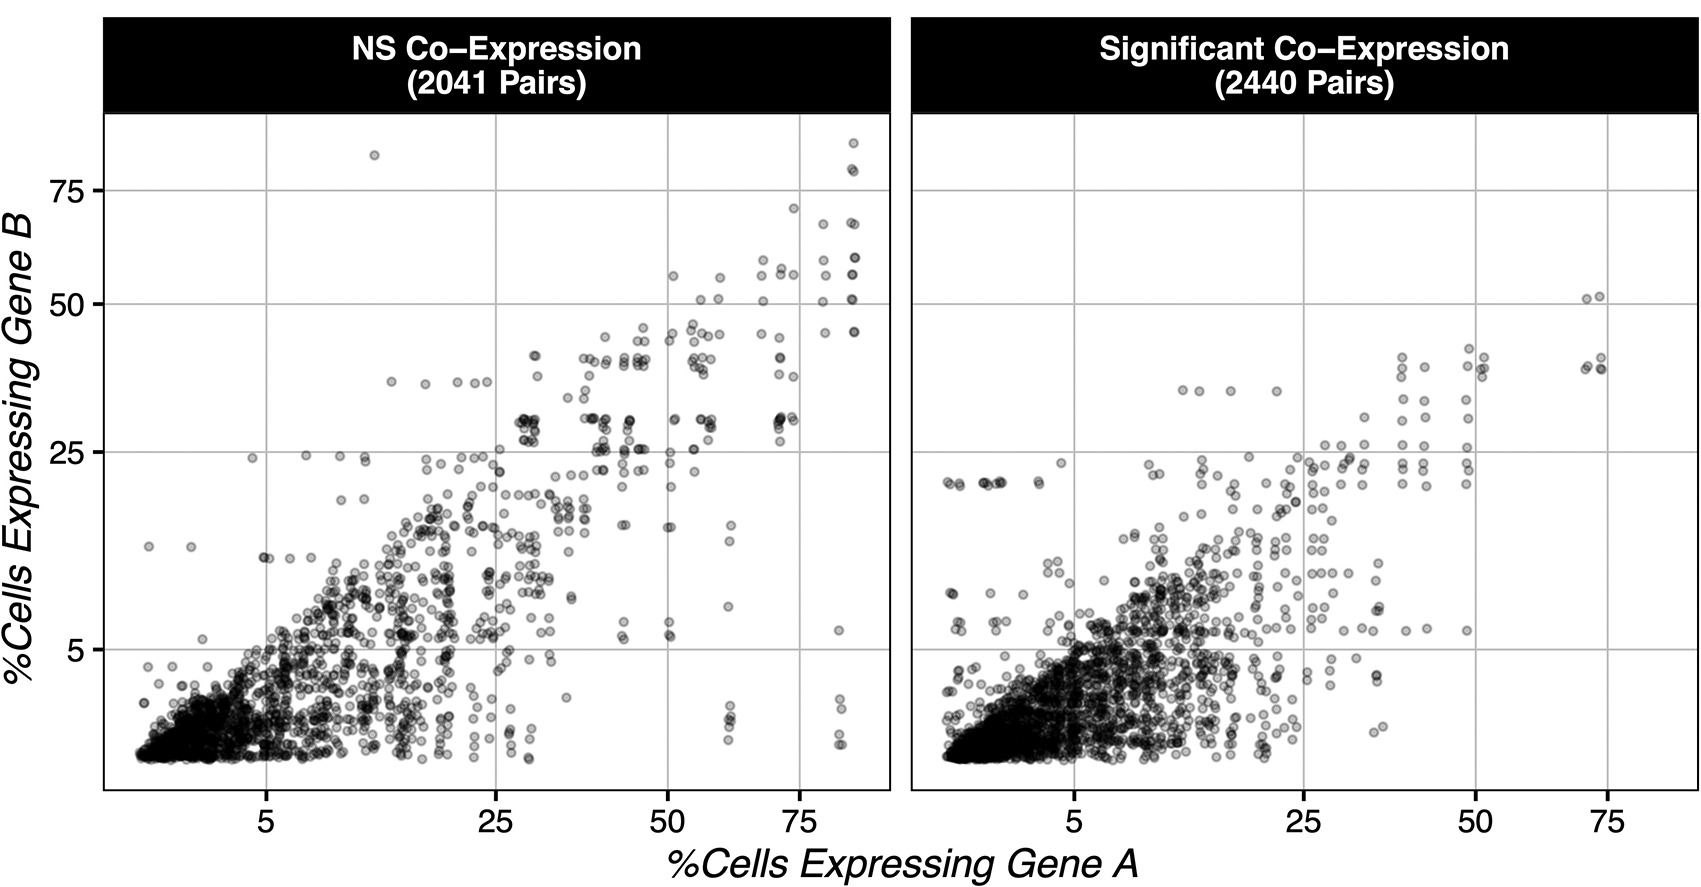
Here, we show that scCoExpress is able to identify co-expressed marker genes as expected across all tissues in Tabula Muris, particularly in cases where both genes are lowly abundant (expressed in <5% of cells). Moreover, when we compare the fraction of significant gene pairs within cell types (expected to be significant) to the fraction of significant gene pairs between cell types (expected to be NS), we see little evidence that scCoExpress is prone to false positive results. Infrequent cases of co-expression between marker genes from different cell type annotations appear to reflect biological truth, such as the case in the 10x marrow set where markers from proerythroblasts and erythroblasts show significant co-expression, or in the 10x lung set where a similar phenomenon occurs between classical and non-classic monocyte marker genes.
Tabula Muris is composed of whole-transcriptome single-cell sequencing data from 20 mouse tissues and organs, se-quenced with either the 10x GemCode Single-Cell 3’ Gel Bead and Library V2 Kit or the SMART-seq2 protocol. Each Tabula Muris set contains between 408 and 11,269 cells. Applications of scCoExpress to other species, sequencing strategies, or dataset sizes have not been directly assessed in this article
Additionally, while it is possible to use scCoExpress to query all possible gene pairs in the genome, this is not recommended due to the memory requirements needed to bootstrap local distributions for n(n-1)/2 comparisons where n equals the total transcriptome size. The intended use case for scCoExpress is to assess pairwise co-expression relationships between a specific set of genes of interest, or to query the whole transcriptome against a specific gene of interest. For pairwise queries of extremely large gene sets, it is recommended to run partition mode with a larger number of partitions and extreme.skipping set to TRUE.
Ethical approval and consent were not required.
This work was supported by the The Razavi Newman Integrative Genomics and Bioinformatics Core Facility of the Salk Institute (RRID:SCR_014842 and SCR_014846) with funding from NIH-NCI CCSG P30 CA014195, NIH-NIA San Diego Nathan Shock Center P30 AG068635, the NIH-NIA Liver Cancer P01 AG073084-04, the Howard and Maryam Newman Family Foundation and the Helmsley Trust.
The funders had no role in study design, data collection and analysis, decision to publish, or preparation of the manuscript.
© 2026 Lande K et al. This is an open access article distributed under the terms of the Creative Commons Attribution License, which permits unrestricted use, distribution, and reproduction in any medium, provided the original work is properly cited.
Current Reviewer Status:
AWAITING PEER REVIEW
AWAITING PEER REVIEW
?
Key to Reviewer Statuses VIEW HIDE
ApprovedThe paper is scientifically sound in its current form and only minor, if any, improvements are suggested
Approved with reservations A number of small changes, sometimes more significant revisions are required to address specific details and improve the papers academic merit.
Not approvedFundamental flaws in the paper seriously undermine the findings and conclusions
Open Peer Review
AWAITING PEER REVIEW
Sign up for content alerts
Alongside their report, reviewers assign a status to the article:
Approved - the paper is scientifically sound in its current form and only minor, if any, improvements are suggested
Approved with reservations - A number of small changes, sometimes more significant revisions are required to address specific details and improve the papers academic merit.
Not approved - fundamental flaws in the paper seriously undermine the findings and conclusions