Просмотр новости
Найдите то, что Вас интересует
 Спутники
 РН
РН SpaceX
 Роскосмос
 NASA
NASA
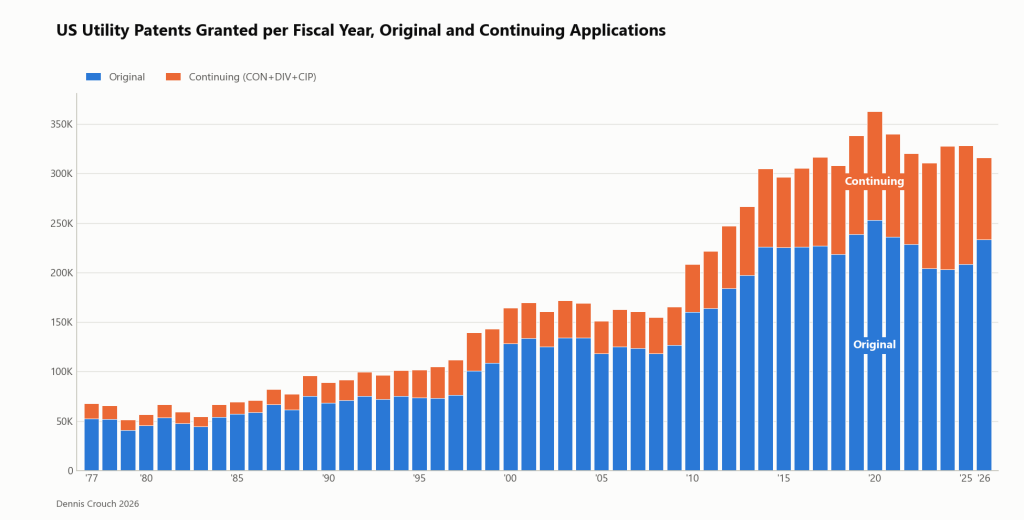
СпутникиРНSpaceXРоскосмосNASAFinal FY2026 numbers: 315,825 utility grants, continuing applications at 26% of grants, US-origin share at 39%, published applications down 6%, and cross-border inventor teams on a record 10.7% of patents.
Continue reading this post on Patently-O.
by Dennis Crouch
This post updates my September 21, 2026 post on FY2026 utility grants that was projecting out to end of the FY. The year is now over. I have also added two new cuts of the data: published applications by origin and cross-border inventor teams.
The USPTO issued 315,825 utility patents in FY2026, down 3.8% from FY2025. About half of this drop is due to a calendar artifact — FY2025 had 53 Tuesdays (the day patents issue) and FY2026 was back to the usual 52. But the weekly rate was down overall about 2%.
The two shifts in the mix that I reported in September held up. Continuing applications (continuations, divisionals, and CIPs) accounted for about 26% of FY2026 utility grants, down from 36% in FY2025. That is a major drop I discussed in prior posts. Patents whose first-named inventor claims US residence fell below 40% for the first time.

The FY2026 decline in the US share again came almost entirely from the US side. US-origin grants fell by about 14k (10%) to 123k, while foreign-origin grants were essentially flat at 193k. Foreign-origin grants have outnumbered US-origin grants every year since FY2008. The first-named inventor convention is an approach the USPTO has previously used, but it is not driving the result. Counting every patent with at least one US-resident inventor, the US share was 42% in FY2026, down from 45% in FY2025.
Published Applications
Published applications show the same pattern one step earlier in the pipeline. The USPTO published about 384k utility applications in FY2026, down 6% from FY2025 and about 10% below the FY2024 peak of 428k. US-origin applications accounted for 147k of the FY2026 publications (38.4%), the fewest US-origin publications since FY2012. Foreign-origin publications also fell, from 248k to 236k.

One caveat with the application data is that it undercounts US-origin filings somewhat – because a small % of US applicants opt out of publication under 35 U.S.C. § 122(b)(2)(B).
Much of the FY2026 drop in published applications came from continuations. Publications of continuing applications fell about 10%, while publications of original applications fell about 4%. That is consistent with the surcharge on late-filed continuations that took effect in January 2025.
Cross-Border Inventor Teams
The US/foreign split algorithm I used above assigns each patent to a single country based upon the residence of the first listed inventor. A growing share of patents do not fit that framework because the listed inventors live in different countries. In FY1977 about 1% of US utility patents named inventors residing in two or more countries. In FY2026 the figure moved over 10%, the highest on record.

The second line shows the cross-border patents that include at least one US-resident inventor. Those accounted for 7.5% of all FY2026 utility patents.
Notes on the data: Grant counts are utility patents by issue date, and the fiscal year runs October 1 through September 30. Origin is the country of residence of the first-named inventor as printed on the patent or publication. A cross-border patent is one whose listed inventors reside in two or more countries. That means a cross-border patent must have at least two inventors.
| # | Наименование новости | Тональность | Информативность | Дата публикации |
|---|---|---|---|---|
| 1 | IP — Federal Circuit Tightens the Grace Period: What a Private Sale Means for Your Patent Rights | 0 | 8.42 | 01-10-2026 |
| 2 | One Determination, Two Clocks: Crocs Asks the Supreme Court to Fix ITC Appeal Deadlines | 0 | 7.01 | 29-09-2026 |
| 3 | Tie Goes to the Applicant: The USPTO’s SMED Flowchart | 0 | 8.87 | 29-09-2026 |
| 4 | Who Owns Mind Reading? | 0 | 14.39 | 28-09-2026 |
| 5 | Clear but Impossible: Satius v. Samsung Moves Inoperable Claims from Indefiniteness to Enablement | 0 | 9.88 | 01-10-2026 |
| 6 | Parting Shot: Mandamus Sends USC v. Google from Judge Albright’s Austin Docket to N.D. Cal. | 0 | 7.13 | 07-10-2026 |
| 7 | Патентная неразбериха: кому выгодно? | 0 | 14.03 | 29-09-2026 |
| 8 | ИП превысил 20 млн рублей: почему патент можно потерять раньше, чем ожидали | 0 | 13.04 | 04-10-2026 |
| 9 | CEDIA Expo 2026! | 0 | 43.33 | 01-10-2026 |
| 10 | EPTS 2026 | 0 | 60 | 06-03-2026 |