Просмотр новости
Найдите то, что Вас интересует
 Спутники
 РН
РН SpaceX
 Роскосмос
 NASA
NASA
СпутникиРНSpaceXРоскосмосNASA
The FBA Reorder Point Formula That Turns “We Should Probably Order Soon” Into a Real Plan
There are several ways to decide when to reorder an Amazon SKU.
The FBA Reorder Point Formula That Turns “We Should Probably Order Soon” Into a Real Plan
There are several ways to decide when to reorder an Amazon SKU.
You can check inventory every morning.
You can stare at the little red “low stock” warning.
You can wait until your best seller is down to 47 units and suddenly discover your supplier needs six weeks.
Or… and hear us out… you could use math.
Not scary math. Not “find X while questioning every life choice that led you back to algebra” math.
One simple formula:
The Reorder Point Formula
Reorder Point = (Average Daily Demand × Lead Time) + Safety Stock
That’s the basic reorder point formula, and if you sell through Amazon FBA, it deserves a permanent spot somewhere between your purchase-order process and your muscle memory.
Amazon describes the same basic calculation as average daily sales multiplied by lead time, plus buffer stock. The point is simple: instead of guessing when inventory is “getting low,” you determine in advance exactly when replenishment should be triggered.
And heading into peak selling periods, that distinction becomes much more important.
Because your reorder point isn’t really an inventory number.
It’s a decision point.
Let’s calculate it properly.
What Is the Reorder Point Formula?The reorder point is the inventory level at which you should trigger your next replenishment order.
In its simplest form:
Reorder Point = (Daily Demand × Lead Time) + Safety Stock
The formula answers one question:
“How much inventory should I have left when it becomes time to reorder?”
It does not tell you how much to buy. We’ll get to that.
First, let’s break down the three numbers you need.
1. Daily DemandDaily demand is the number of units you expect a SKU to sell each day.
The easiest approach is:
Total units sold during a period ÷ Number of days in that period
If a SKU sold 900 units over the last 30 days:
900 ÷ 30 = 30 units per day
Easy.
But there’s a catch.
And its name is Q4.
More on that shortly.
2. Lead TimeLead time is how long it takes to go from “We need more inventory” to “That inventory is actually available to sell.”
For an FBA seller, that can include more than supplier production time.
Depending on your supply chain, consider:
If your factory takes 20 days, transportation takes 12, prep takes 3, and you normally allow another 5 days before everything is actually available:
Your practical lead time isn’t 20 days.
It’s closer to 40 days.
That difference matters.
A lot.
3. Safety StockSafety stock is the buffer between your forecast and reality.
Because reality occasionally enjoys improvising.
Demand spikes.
Suppliers run late.
Containers get delayed.
Amazon receiving takes longer than expected.
A promotion performs much better than anticipated.
Safety stock gives you additional inventory to absorb some of that uncertainty without immediately heading toward a stockout.
A Simple FBA Reorder Point ExampleSuppose one SKU averages:
Your calculation is:
(20 × 30) + 200 = 800 units
Your reorder point is 800 units.
In plain English:
When the SKU reaches approximately 800 units of inventory position, it’s time to initiate replenishment.
Not when it hits 400.
Not when someone happens to notice it on Friday afternoon.
Not when you hear the faint sound of an Amazon seller screaming somewhere in the distance.
At 800 units.
That’s the beauty of a reorder point.
It turns replenishment from a reaction into a rule.
Here is where the simple reorder point formula gets more interesting.
Using average daily demand works well if the future behaves roughly like the period you’re averaging.
Peak season tends to have other plans.
Imagine this sales pattern:
| Period | Average Daily Sales |
|---|---|
| 61–90 days ago | 17 units |
| 31–60 days ago | 21 units |
| Last 30 days | 29 units |
A flat 90-day average gives you:
22.3 units per day
But your most recent 30 days are already running at:
29 units per day
If you’re heading into a period when demand is expected to rise further, building your reorder point around 22 units per day could leave your plan looking wonderfully accurate right up until the moment it isn’t.
This Is Where Weighted Demand Becomes More UsefulInstead of treating sales from three months ago exactly the same as sales last week, you can give more recent or more relevant periods greater weight.
For example:
Using our example:
(29 × .50) + (21 × .30) + (17 × .20)
That gives you approximately:
24.2 expected units per day
Still conservative compared with the most recent sales rate—but more responsive than simply averaging everything equally.
And a sophisticated forecasting model can go further by accounting for things like seasonality, changing sales velocity, historical patterns, and other demand signals rather than relying on one trailing average.
Amazon itself says its FBA restock recommendations use sales history, demand forecasting, and seasonality to help determine when and how much inventory sellers should send. Amazon also recommends forecasting future demand when planning inventory for holidays and major sales periods such as Black Friday.
The Data-Driven Forecasting AdvantageThe broader inventory research points in the same direction.
One academic comparison tested forecasting approaches across roughly 200,000 forecasts and found that optimally weighted moving-average methods performed better overall than the traditional forecasting methods evaluated.
In another real-world example, McKinsey described a distributor that built a data-driven demand forecasting model across more than 100,000 SKUs. The company reduced inventory by 20% while significantly reducing out-of-stocks after improving its forecasts, safety stock calculations, and lead-time planning.
That doesn’t mean every Amazon seller who changes a spreadsheet formula magically gets 20% less inventory and zero stockouts.
Would be nice.
It does illustrate the important principle:
Better demand inputs produce better inventory decisions.
And when demand is accelerating, simple trailing averages are more likely to miss what’s happening next.
Your Reorder Point Should Change When Demand ChangesThis is the part that occasionally gets lost.
A reorder point shouldn’t necessarily be carved into stone.
If a SKU’s:
…then the appropriate reorder point changes too.
Let’s revisit our earlier SKU.
Scenario A: Normal Demand
Demand: 20 units/day
Lead time: 30 days
Safety stock: 200 units
Reorder point = 800 units
Scenario B: Peak-Season Demand
Forecasted demand: 28 units/day
Lead time: 30 days
Safety stock: 200 units
Reorder point = 1,040 units
Same product.
Same supplier.
Same safety stock.
But you need to trigger your reorder 240 units earlier because inventory is disappearing faster.
If you’re still operating from the old 800-unit reorder point, your formula isn’t technically wrong.
Your assumptions are.
Reorder Point vs. Reorder Quantity: Please Don’t Make Them the Same ThingThis distinction is important.
Your Reorder Point Tells You When to OrderThe reorder point answers:
“At what inventory level should I initiate replenishment?”
Your Reorder Quantity Tells You How Much to OrderThat’s a separate decision.
Your reorder quantity may depend on:
So:
Reorder Point
= when
Reorder Quantity
= how much
Confusing the two is a great way to turn a useful inventory formula into a very expensive guessing game.
Safety Stock Isn’t “Whatever Number Feels Safe”Safety stock is sometimes treated like the emergency granola bar in your desk drawer.
Just throw some extra in there.
But safety stock should reflect actual risk.
Consider More Safety Stock When:
Consider Less Safety Stock When:
More safety stock isn’t automatically better.
Too little creates stockout risk.
Too much ties up cash.
Welcome to inventory management, where both sides of the seesaw have invoices attached.
The SKU-by-SKU Reorder Rule FBA Sellers Actually NeedFor each SKU, work through the same five questions.
1. What demand should I realistically expect?Don’t automatically assume the last 30, 60, or 90 days will repeat.
Ask whether demand is:
Use the demand estimate that best represents what is likely to happen during the upcoming lead-time period.
2. How long will replenishment really take?Use total operational lead time—not just the number on the supplier quote.
If it takes 45 days from purchase order to sellable inventory, use 45 days.
Your factory’s production schedule does not care that your spreadsheet says 30.
3. How much uncertainty do I need to protect against?Set safety stock based on the SKU’s actual demand and supply risk.
4. What is my reorder point?Now calculate:
Expected Daily Demand × Lead Time + Safety Stock
If yes, the SKU has entered the reorder decision zone.
Notice we didn’t say:
“Place a giant purchase order immediately.”
Because there’s one more question.
And it might be the most important one.
The Formula Can Tell You When to Reorder. It Can’t Tell You Whether You Should.Here is where inventory planning becomes a business decision instead of an arithmetic exercise.
Imagine two products.
SKU A
SKU B
Both SKUs may need inventory.
But if your purchasing budget is limited, should they receive the same share of your next inventory dollar?
Probably not.
This is the bigger idea behind profit-aware replenishment.
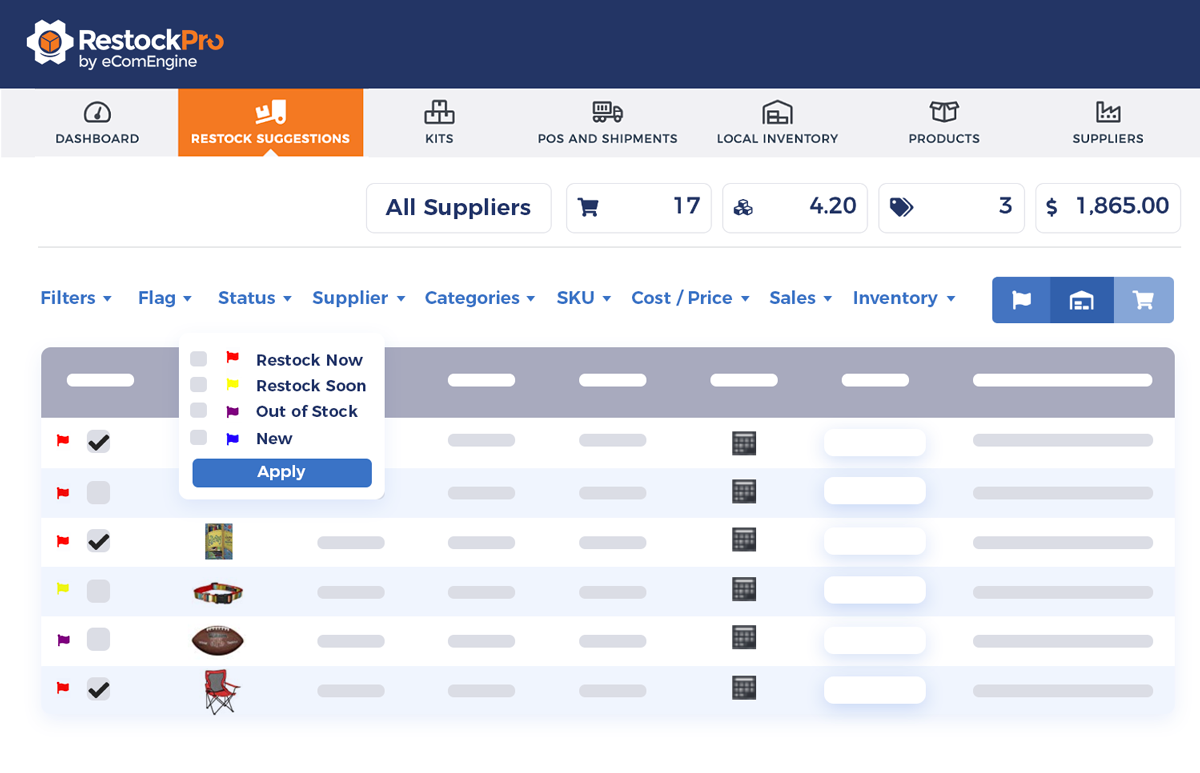
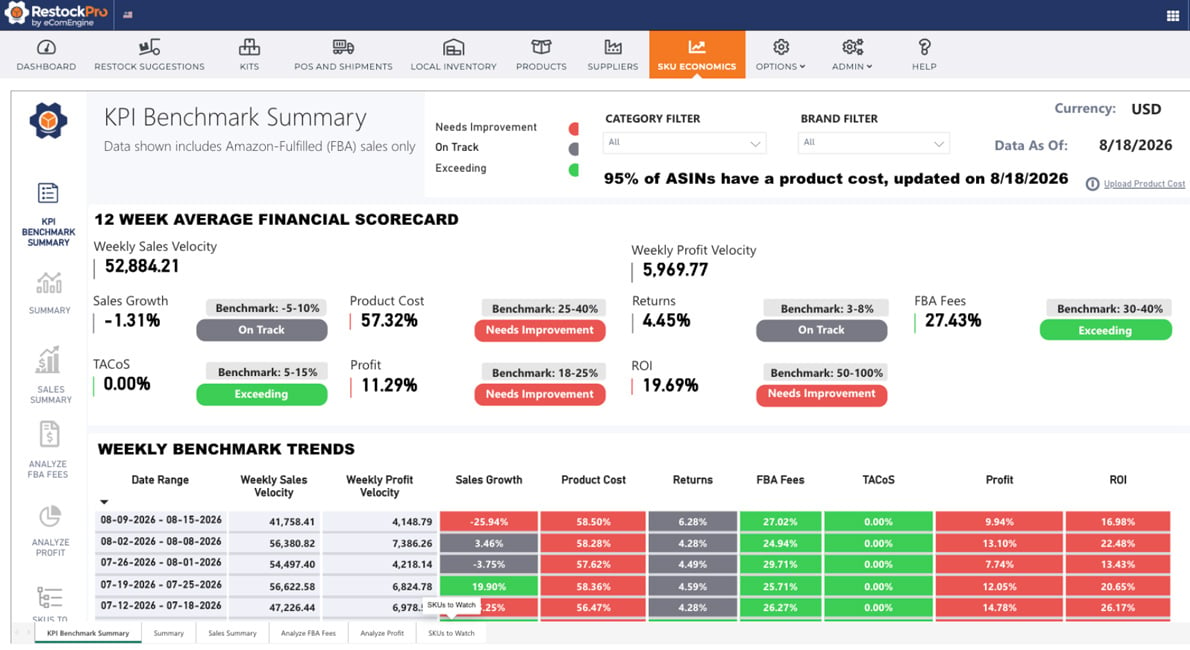
RestockPro already supports forecasting, restock suggestions, purchase orders, shipments, suppliers, and broader inventory planning. RestockPro Plus adds SKU Economics, bringing profitability information into that replenishment decision so sellers can think beyond simply what is running low.
The goal becomes:
That third question matters.
Because a fast-selling SKU can still be a lousy place to put your money.
Your Next Purchase Order Shouldn’t Be a Popularity ContestOne of the easiest Amazon inventory mistakes is assuming:
Best seller = best reorder
Not necessarily.
Sales velocity tells you that a product is moving.
It doesn’t automatically tell you whether replenishing it is the best use of your available capital.
Before committing more inventory dollars, look beyond units sold and consider:
That’s especially important in Q4, when several SKUs may all be waving their hands asking for more inventory at exactly the same time.
Your cash, meanwhile, remains inconveniently finite.
RestockPro Plus is designed around this exact progression: connect inventory planning with SKU-level economics so replenishment can become a profit-aware decision, not simply a response to sales velocity.
5 Common Reorder Point Mistakes That Create Avoidable FBA Inventory ProblemsMistake #1: Using the Same Sales Average All Year
A 90-day average can hide accelerating or declining demand.
If recent demand differs materially from older demand, give the newer information the attention it deserves.
Mistake #2: Underestimating Lead Time
Production time is not always total lead time.
Account for the entire journey from purchase order to inventory that’s actually available for sale.
Mistake #3: Setting Safety Stock Once and Forgetting It
Safety stock should change when risk changes.
A SKU with stable spring demand may need a different buffer heading into November.
Mistake #4: Waiting Until Inventory “Looks Low”
“Looks low” isn’t a replenishment methodology.
Calculate the trigger before you need it.
Mistake #5: Reordering a SKU Just Because the Formula Says It’s Time
A reorder point tells you when inventory needs attention.
It does not guarantee that buying more inventory is financially wise.
Before placing the PO, ask whether that SKU still deserves your capital.
That little question can save a very large check.
For every important SKU, start with three numbers:
Then calculate:
Reorder Point = (Expected Daily Demand × Lead Time) + Safety Stock
Do it SKU by SKU.
Update it when demand changes.
And when a SKU reaches that threshold, don’t stop at “How much should I buy?”
Ask the better question:
“Is this where my next inventory dollar should go?”
CALCULATE YOUR REORDER POINT
Turn your demand, lead time, and safety stock into a smarter replenishment trigger… then use RestockPro Plus to bring inventory planning and SKU Economics together before your next purchase order.
Q: What is the reorder point formula?
The standard reorder point formula is: (average daily demand × lead time) + safety stock.
For example, if a SKU sells 20 units per day, requires 30 days to replenish, and has 200 units of safety stock, its reorder point is 800 units.
When inventory reaches that threshold, the SKU should enter your replenishment process.
Q: How do I calculate a reorder point for Amazon FBA inventory?
To calculate an FBA reorder point, estimate the SKU’s expected daily demand, multiply it by the total number of days required to replenish inventory, and add appropriate safety stock.
FBA Reorder Point = (Expected Daily Demand × Total Lead Time) + Safety Stock
For FBA sellers, total lead time may include supplier production, shipping, customs, prep, delivery to Amazon, and receiving time before inventory becomes available for sale.
Q: What is the difference between reorder point and safety stock?
A reorder point is the inventory level that triggers replenishment. Safety stock is extra inventory held to reduce the risk of running out because of unexpected demand or supply delays.
Safety stock is one component of the reorder point formula:
Reorder Point = Lead-Time Demand + Safety Stock
The reorder point tells you when to act. Safety stock gives you a buffer if reality doesn’t follow the forecast exactly.
Q: How much safety stock should an FBA seller keep?
There is no single safety-stock quantity that works for every FBA SKU. The right amount depends on demand variability, supplier reliability, replenishment lead time, seasonality, and the business impact of a stockout.
SKUs with volatile demand or long, unreliable lead times may justify larger buffers. Predictable SKUs with short, reliable replenishment cycles may require less.
Safety stock should therefore be calculated and reviewed SKU by SKU, rather than applying the same arbitrary buffer across an entire catalog.
Q: Should I use 30-day, 60-day, or 90-day sales when calculating reorder points?
Use the demand period that most accurately represents what you expect to sell during the upcoming replenishment period.
A trailing 30-, 60-, or 90-day average can work when demand is relatively stable. When demand is changing, however, a weighted forecast that gives greater importance to recent or seasonally relevant sales may provide a better planning input.
This is particularly important before Q4, Prime Day, promotions, or other periods when future demand may look very different from a simple historical average.
Q: How often should I recalculate my reorder points?
Reorder points should be reviewed whenever the assumptions behind them materially change.
Recalculate or review a SKU’s reorder point when:
For high-volume or highly seasonal FBA products, reorder points may need substantially more frequent review than slow-moving, predictable SKUs.
Q: Does reaching the reorder point mean I should automatically reorder the SKU?
No. Reaching the reorder point means a SKU requires a replenishment decision; it does not automatically mean buying more inventory is the best financial decision.
Before placing a purchase order, consider expected demand alongside the SKU’s margin, costs, fees, returns, inventory investment, and overall profitability.
RestockPro Plus brings SKU Economics into the inventory-planning process so sellers can evaluate both sides of the decision: when inventory may need replenishment and whether that SKU deserves additional investment.
Running out of your most profitable inventory hurts.
So does spending thousands of dollars replenishing a SKU that’s great at generating revenue and considerably less enthusiastic about generating profit.
RestockPro Plus helps connect forecasting and replenishment planning with SKU-level economics, giving you a clearer view of what to reorder, when to reorder it, and where your inventory dollars may work hardest.
Because the goal isn’t to keep every SKU fully stocked at any cost.
It’s to put the right inventory (and the right amount of cash) in the right place.
| # | Наименование новости | Тональность | Информативность | Дата публикации |
|---|---|---|---|---|
| 1 | What to Scale, Fix, or Stop Restocking Before Q4 | 0 | 10.43 | 27-07-2026 |
| 2 | Amazon Changed Its Fees Again — Here’s What It Actually Costs You | 0 | 17.07 | 11-09-2026 |
| 3 | How Much Inventory Can You Actually Afford to Buy Before Q4? | 0 | 11.78 | 10-08-2026 |
| 4 | The Amazon Reimbursement Clock Is Ticking — Audit Before You Lock In Q4 Cash | 0 | 9.56 | 24-08-2026 |
| 5 | Stop Guessing: Building a September Q4 PO Without Overcommitting Cash | 0 | 15.59 | 18-09-2026 |
| 6 | SKU Economics 201: Turning Your Profit Audit Into a Monthly Habit | 0 | 16.84 | 21-09-2026 |
| 7 | Scale, Fix, Watch, Stop Restocking: Turning July’s Audit Into a Q4 PO | 0 | 8.19 | 04-08-2026 |
| 8 | Your IPI Score Is About to Matter More Than You Think | 0 | 9.37 | 19-08-2026 |
| 9 | Spend Less, Profit More: PPC and Inventory Strategy For Amazon Sellers | 0 | 14.18 | 02-09-2026 |
| 10 | Сотни селлеров ищут про фулфилмент wb отзывы как выбрать партнера, ... | 0 | 7.17 | 18-09-2026 |