Просмотр новости
Найдите то, что Вас интересует
 Спутники
 РН
РН SpaceX
 Роскосмос
 NASA
NASA
СпутникиРНSpaceXРоскосмосNASABrewery visits may be higher than ever, even as many taprooms continue to face difficult business conditions. This analysis estimates total brewery visits over time and explores why that growth may not feel evenly distributed across the industry. From the changing role of “power visitors” to regional and demographic differences in visitation, the data shows that craft drinkers are still going out to breweries. The challenge for individual businesses is turning those visits into stronger performance through positioning, hospitality, and giving customers a clear reason to choose their taproom.
The post Brewery Visits Are Up. Wait, What? appeared first on Brewers Association.
A question came across my desk recently that made me do a double take. The inquirer asked if the total number of brewery visits was at its highest level ever. After a couple years of tough headlines, I thought “how could that be?”
While we do not collect this data directly, what are the backs of envelopes for if not this type of calculation? To come to a rough (but reasonable) estimate, I took the product of the number of legal drinking age (LDA) Americans (Census Bureau), the share of LDA who consume craft beer (NIQ Scarborough), and the average number of annual brewery visits by craft beer drinkers (Brewers Association/Harris Poll Consumer Survey). In this exercise, I didn’t have data for every year listed, so I made some estimates based on trends.
And while these results are based on estimates, they should help us at least compare years side-by-side. The TL;DR of it suggests 2026 is, in fact, poised to become the year with the most brewery visits in recent history.
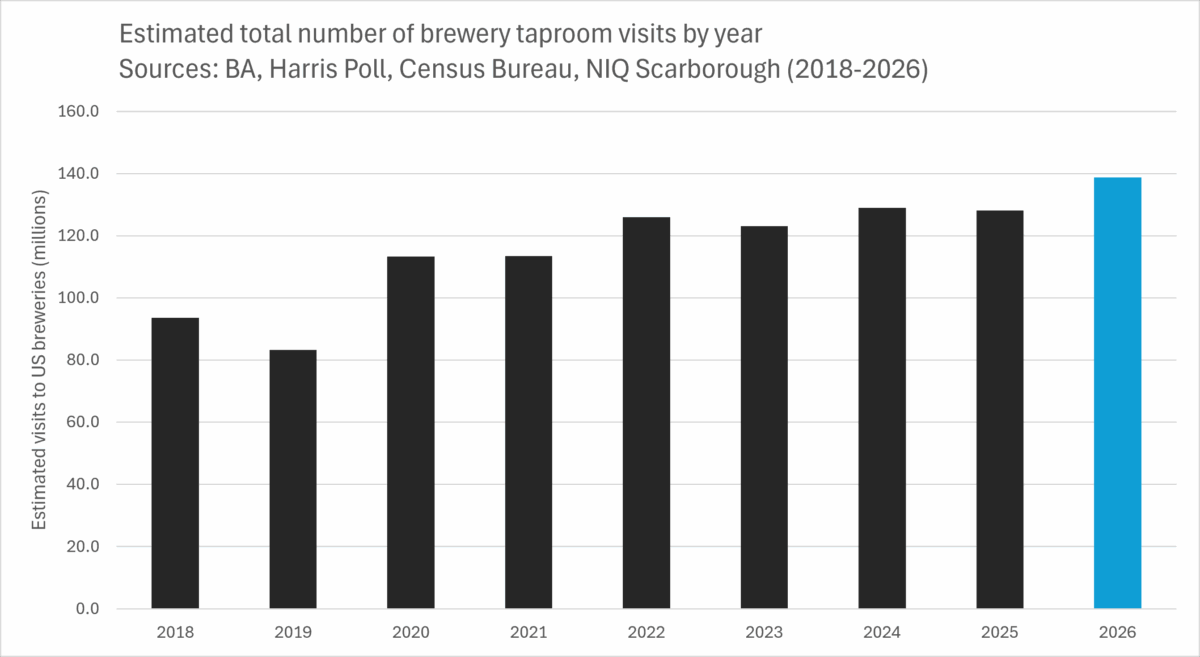
How? In an environment where many breweries are feeling the struggle of declining taproom sales, how does this square?
A simple answer would be that NIQ Scarborough and Harris Poll are pulling non-representative samples, artificially inflating the share of LDA drinking craft and the visits per craft drinker, respectively. However, Scarborough receives over 20,000 responses while Harris Poll collects more than 2,000 responses. Based on their statistical approaches, we should assume the results are representative of the overall population.
There is, however, impact from outliers that influence the averages. In the 2026 Harris Poll, when removing upside outliers (i.e. the “power visitors”), the average number of annual visits becomes 3.5 rather than the 5.5 average with all survey respondents. This figure is still up notably from the 2018 average with outliers removed (2.4 annual visits). Consequently, removing outliers may bring down the overall estimate for annual visits, but it does so across the board and does not change the relative bump in 2026 compared to 2018. Craft drinkers simply appear to be visiting more breweries today than they did prior to the pandemic.
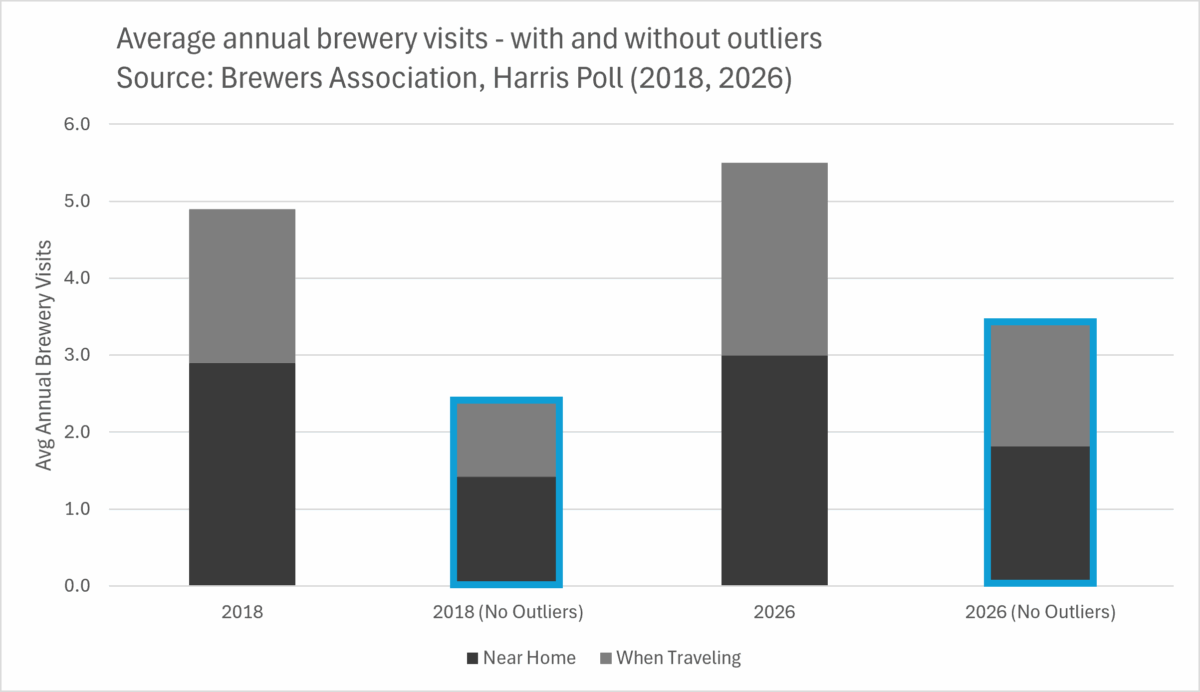
Let’s not jump so quickly over the “power visitors.” It’s notable that between 2018 and 2026, the share of overall brewery visits from the power visitors has declined substantially. In 2018, 60% of visits were made by the top 10% of visitors (i.e. the people who got out regularly). As of 2026, that figure dropped to 47% of visits by power visitors. This could be why we’ve seen loyalty programs on the decline and can be a good reminder that developing a business model focused on “the regulars” may be a tougher sell these days.
So, what if the rising visit rates aren’t being felt by brewery owners because there are just more breweries operating (spreading out those annual visits)? This explanation does not hold up either. The number of operating breweries experienced slowing growth in past years, descending to the point of slight decline in 2025. This trend held for onsite breweries as well, leading the average visits per onsite brewery to increase for the past three years.
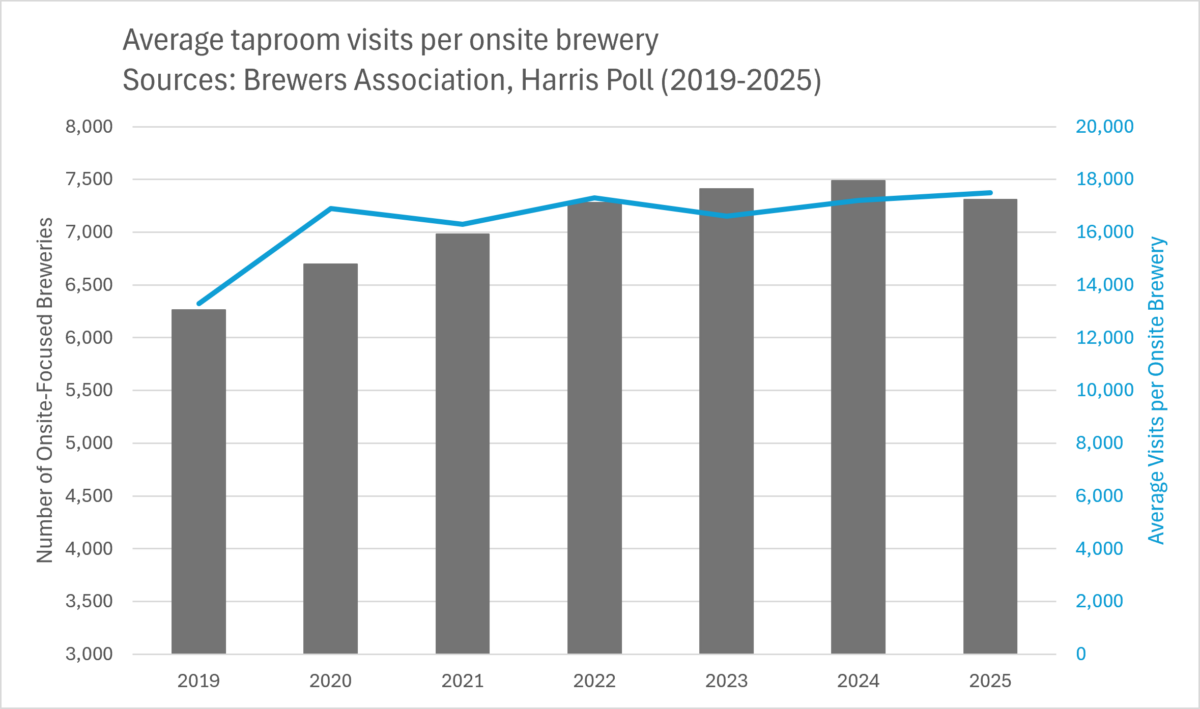
Of course, the U.S. craft beer industry is not a monolith, so average visits per brewery does not mean all breweries would experience those gains. There’s wide variability based on where a brewery is located as well as what type of audience each business attracts.
As such, I took a look at the average number of visits by different demographic groups from the most recent Harris Poll (2026) compared to pre-pandemic in 2018. While both men and women are visiting more breweries now than in 2018, women are visiting fewer local breweries and instead opting for more while traveling. Craft drinkers aged 21-54 are visiting more breweries while drinkers 55+ are sinking further away from the population mean for visits. Regionality also seems to be playing a role with higher average visits in the West and South today than in 2018, accompanied by drops in the Midwest and Northeast.
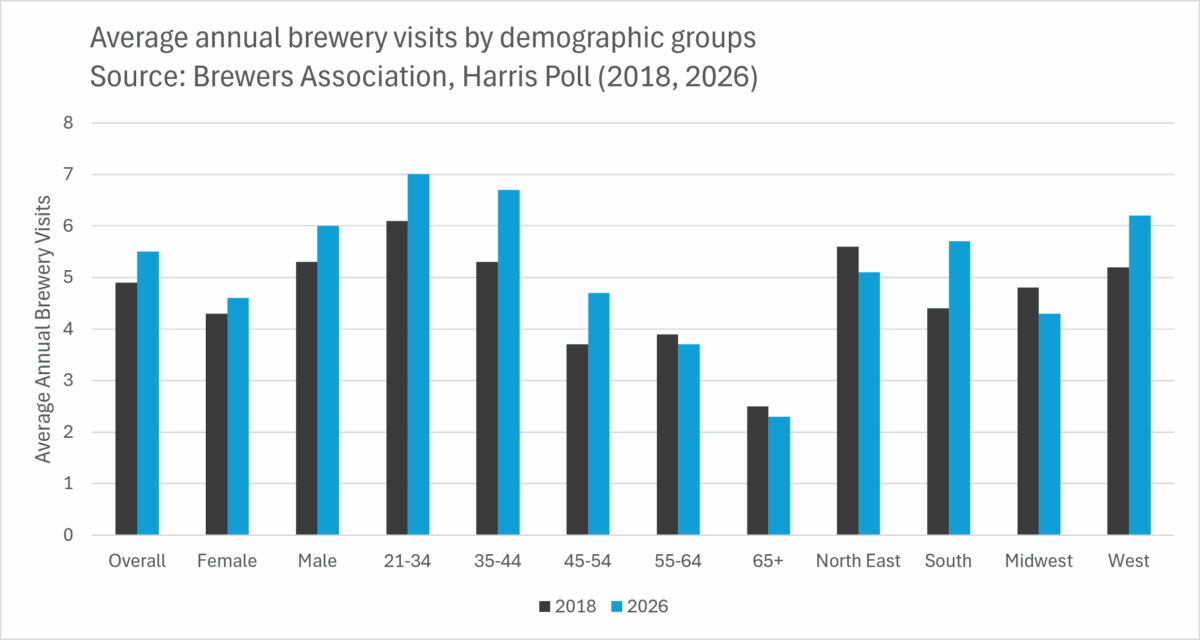
In short, the experience of increased brewery visitors is not uniform across the industry. Additionally, other challenges facing the industry could simply be outweighing the feeling of the slight bump in brewery visits. More people coming through the door may not move the needle against declining ticket sizes, rising operational costs, and all of the other factors working against breweries right now. And yet, while there are certainly breweries struggling, it’s also important to remember that there are breweries having their best year yet.
In such a large and diverse industry, there’s always nuance beyond the headline figure. The takeaway is that craft drinkers are still going out to breweries, seemingly more than ever. Figuring out how to position your brand and how to perfect your hospitality model, however, are the factors that will determine whether those visits will be at your taproom or at someone else’s.
Was this article helpful?
YesNo
| # | Наименование новости | Тональность | Информативность | Дата публикации |
|---|---|---|---|---|
| 1 | Sunrise: Brewery Openings | 0 | 7.92 | 06-07-2026 |
| 2 | Your Servers Are Your Best Marketing — If You Train Them | 0 | 8.93 | 21-07-2026 |
| 3 | Redefining Success in Brewery Operations | 0 | 9.41 | 28-07-2026 |
| 4 | Quick Take: Injury Rates in Breweries | 0 | 8.55 | 14-07-2026 |
| 5 | Cincy Light Vs. Cold Time: Two Lager Brands, Two Very Different Paths | 0 | 6.67 | 13-08-2026 |
| 6 | Rising to the Occasion: Positioning NA Beer | 0 | 9.9 | 28-05-2026 |
| 7 | What Firestone Walker Brewing Company Can Teach Every Brewery About Social Media | 0 | 6.41 | 10-08-2026 |
| 8 | Hemp Beverages and the Future of Drinking | 0 | 8.77 | 23-04-2026 |
| 9 | Shares of world's largest brewer AB InBev tumble 9% on declining volumes | -5 | 7 | 31-07-2025 |
| 10 | From Guesswork to Confidence: Leveraging Data-Driven Fermentation for Quality, Efficiency & Profit | 0 | 13.1 | 23-04-2026 |