Просмотр новости
Найдите то, что Вас интересует
 Спутники
 РН
РН SpaceX
 Роскосмос
 NASA
NASA
СпутникиРНSpaceXРоскосмосNASABackground Peru presents a paradigmatic case of hydrological asymmetry, where national water abundance (56,887 m3/capita/year) masks acute regional scarcity. The Pacific basin, hosting 66.4% of the population, possesses only 1.9% of renewable water resources (1,628 m3/capita/year), falling below the Falkenmark water stress threshold (1,700 m3/capita/year). Conversely, the Amazon basin holds 97.8% of resources for 30.4% of the population (183,142 m3/capita/year). This 112.5-fold asymmetry ratio exceeds comparable international cases (Egypt: 49.2; China: 8.0), yet Peru lacks systemic redistribution mechanisms. Policy and Implications Current governance frameworks under Law 29338 (2009) have failed to address territorial misalignment between supply, demand, and institutional capacity. Economic compensation mechanisms (S/205.5 million annually) paradoxically tax scarcity rather than value ecosystem services, with the Pacific basin contributing 61.7% of revenues despite extreme resource constraints. Groundwater extraction in coastal regions operates at 100% of renewable recharge limits, indicating unsustainable fossil aquifer mining. Climate projections indicate 30% runoff reduction in glacier-fed Pacific basins by 2100, exacerbating existing stress. Recommendations (1) Implement basin-scale demand management and irrigation efficiency programmes in the Pacific basin; (2) Strengthen groundwater monitoring and abstraction controls to prevent irreversible depletion; (3) Reform economic compensation mechanisms to incorporate ecosystem service valuation, redistributing revenues toward hydrologically strategic headwater regions; (4) Integrate indigenous water governance systems (comunidades campesinas, ayllus) into state planning frameworks; (5) Establish inter-basin transfer feasibility studies given the extreme asymmetry ratio. Conclusions Peru’s water challenge stems from governance asymmetry layered upon hydrological asymmetry, not absolute scarcity. Without institutional mechanisms reconciling hydrology, demography, and political economy, climatic variability will entrench coastal scarcity while Amazonian abundance remains underutilised. The integrated assessment framework presented provides transferable insights for water-rich yet spatially asymmetric nations facing increasing climatic variability.
Policy Brief
[version 1; peer review: 2 approved]
Juan Eduardo Suarez Rivadeneira
https://orcid.org/0009-0006-0597-6370
1, Freddy A Manayayhttps://orcid.org/0000-0002-1790-0107
2, Jhon Danilson Campos Mego1, Wilfredo Ruiz Camacho1, Italo Maldonado Ramirez1, Gustavo Adolfo Perez Londoño1Juan Eduardo Suarez Rivadeneira
https://orcid.org/0009-0006-0597-6370
1, Freddy A Manayayhttps://orcid.org/0000-0002-1790-0107
2, [...] Jhon Danilson Campos Mego1, Wilfredo Ruiz Camacho1, Italo Maldonado Ramirez1, Gustavo Adolfo Perez Londoño11 Mechanical and Electrical Engineering Professional School, National University Toribio Rodríguez de Mendoza of Amazonas, Bagua, 0172, Peru
2 Biosystems Engineering Professional School, National University Toribio Rodríguez de Mendoza of Amazonas, Chachapoyas, Amazonas, 01001, Peru
Juan Eduardo Suarez Rivadeneira
Roles: Conceptualization, Formal Analysis, Methodology, Writing – Original Draft Preparation, Writing – Review & Editing
Freddy A Manayay
Roles: Conceptualization, Writing – Original Draft Preparation, Writing – Review & Editing
Jhon Danilson Campos Mego
Roles: Formal Analysis, Validation, Writing – Review & Editing
Wilfredo Ruiz Camacho
Roles: Methodology, Validation, Writing – Review & Editing
Italo Maldonado Ramirez
Roles: Formal Analysis, Validation
Gustavo Adolfo Perez Londoño
Roles: Investigation, Validation, Writing – Review & Editing
OPEN PEER REVIEW
REVIEWER STATUS
Corresponding authors: Juan Eduardo Suarez Rivadeneira, Freddy A Manayay Competing interests: No competing interests were disclosed.
Grant information: The author(s) declared that no grants were involved in supporting this work.
Copyright: © 2026 Suarez Rivadeneira JE et al. This is an open access article distributed under the terms of the Creative Commons Attribution License, which permits unrestricted use, distribution, and reproduction in any medium, provided the original work is properly cited. How to cite: Suarez Rivadeneira JE, Manayay FA, Campos Mego JD et al. Hydrological asymmetry and water stress in Peru: An integrated assessment of resource distribution, anthropogenic pressure, and governance gaps across three drainage basins [version 1; peer review: 2 approved]. F1000Research 2026, 15:456 (https://doi.org/10.12688/f1000research.176208.1) First published: 30 Mar 2026, 15:456 (https://doi.org/10.12688/f1000research.176208.1) Latest published: 30 Mar 2026, 15:456 (https://doi.org/10.12688/f1000research.176208.1)
Water scarcity affects 4 billion people globally, with physical scarcity (insufficient resources) and economic scarcity (inadequate infrastructure) representing distinct governance challenges.1,2 The Falkenmark Water Stress Index remains the standard metric for physical scarcity assessment, though composite indices (Water Poverty Index, Global Water Security Index) provide multidimensional perspectives.3–6 Nations facing extreme hydrological asymmetry—Egypt (Nile dependence, 55 m3/capita/year renewable resources), Israel (arid climate, 230 m3/capita/year), and China (North-South disparity, 8-fold difference)—have implemented diverse governance responses7–9: inter-basin transfers, desalination, and virtual water trade.7,10
Peru’s hydrological configuration presents a unique case: national abundance (56,887 m3/capita/year) coexists with regional scarcity (1,628 m3/capita/year in Pacific basin).11,12 This “scarcity amidst abundance” paradox distinguishes Peru from uniformly water-stressed nations and demands tailored governance approaches.12,13
Peru’s territory (1,285,216 km2) encompasses three major drainage basins: Pacific (278,482 km2, 21.7%), Amazon (957,823 km2, 74.5%), and Titicaca (48,911 km2, 3.8%).14,15 The 2025 population (34,038,457) is distributed highly unevenly: 66.4% in the Pacific basin, 30.4% in Amazon, 3.2% in Titicaca.16 This demographic pattern inverts hydrological endowment: the Pacific basin possesses 1.9% of water resources; the Amazon basin holds 97.8%.17,18
The Pacific basin’s per capita availability (1,628 m3/capita/year) falls below the water stress threshold (1,700 m3/capita/year), positioning it alongside traditionally water-scarce regions.19,20 However, the Amazon basin’s abundance (183,142 m3/capita/year) creates national average availability (56,887 m3/capita/year) that masks critical regional stress.19,21
Integrated Water Resources Management (IWRM), formalised at the 1992 Dublin and Rio conferences, emphasises cross-sectoral coordination and multi-level governance.22,23 Peru’s Law No. 29338 (2009) established the National Water Authority (ANA) as the IWRM implementing institution, with subsequent regulations addressing hydraulic infrastructure, economic compensation, and watershed councils.17,22
Despite institutional development, implementation gaps persist. Groundwater remains inadequately characterised (only 31% of 159 aquifers studied).14,18 Economic compensation mechanisms collect S/. 205.5 million annually but distribute revenues inequitably.24,25 Climate change projections indicate 30% runoff reduction in the Pacific basin by 2100 due to glacier retreat.26
This study addresses four research questions: 1. What is the magnitude and uncertainty of hydrological disparities across Peru’s basins? 2. How do these disparities compare internationally? 3. What governance mechanisms have failed to address the asymmetry? And 4. What policy interventions can achieve hydrological equity?
Pacific Basin: Arid coastal region (precipitation: 0–200 mm/year in lowlands, 1,000–2,000 mm in Andean headwaters). Population: 22,601,357 (2025). Water resources: 36,804 million hm3/year.
Amazon Basin: Tropical rainforest (precipitation: 2,000–3,000 mm/year). Population: 10,336,549. Water resources: 1,893,055 million hm3/year.
Titicaca Basin: High-altitude plateau (3,600–4,500 m elevation). Population: 1,100,551. Water resources: 6,468 million hm3/year.
Data sources: ANA hydrological records (2024), INEI census (2017) and projections (2025), SNIRH monitoring network.
Falkenmark Water Stress Index (WSI):
WSIi=TRWRiPiX106
Where WSIi = Water Stress Index for basin i (m3/capita/year), TRWRi = Total Renewable Water Resources (hm3/year), Pi = Population.
Uncertainty Quantification: Monte Carlo simulation (n = 10,000 iterations) with parameter distributions:
• Population: Normal distribution, σ = 2% of mean (census uncertainty)
• Water resources: Triangular distribution, ±15% range (measurement error)
• Extraction rates: Uniform distribution, ±10% range
DPi=∑sUi,sTRWRiX100
Where Ui,s Water use in sector s (agricultural, industrial, population, energy) in basin i .
Mann-Kendall Trend Test: Applied to time series data (1990–2025) to detect monotonic trends in water stress indicators27:
S=∑i=1n−1∑j=i+1nsgn(xj−xi)
Where sgn() is the sign function, x = annual WSI values.
Comparative Analysis: International comparison using standardised metrics:
Governance failure analysis employed the “hydrosocial cycle” concept, examining how political and economic power relations shape water distribution.30 Key dimensions:
• Accumulation by dispossession: Historical concentration of water rights in export agriculture and mining
• Scalar politics: Mismatch between watershed boundaries and administrative jurisdictions
• Knowledge politics: Exclusion of indigenous water management systems from state planning
Monte Carlo simulations reveal significant uncertainty ranges ( Table 1). The Pacific basin WSI (1,628 m3/capita/year) has 95% CI of 1,512-1,744, confirming water stress conditions even under optimistic scenarios. The Amazon basin WSI (183,142 m3/capita/year, 95% CI: 155,171-211,113) maintains abundance across all simulations.
The WSI distribution of the Pacific basin ( Figure 1A) shows a mean of 1,628 with a 95% confidence interval between 1,512 and 1,744. This indicates that the majority of simulations (>95%) exceed the 1,000 scarcity threshold, and there is uncertainty regarding whether the stress condition crosses the critical 1,700 threshold, as the upper portion of the distribution reaches values higher than this limit.
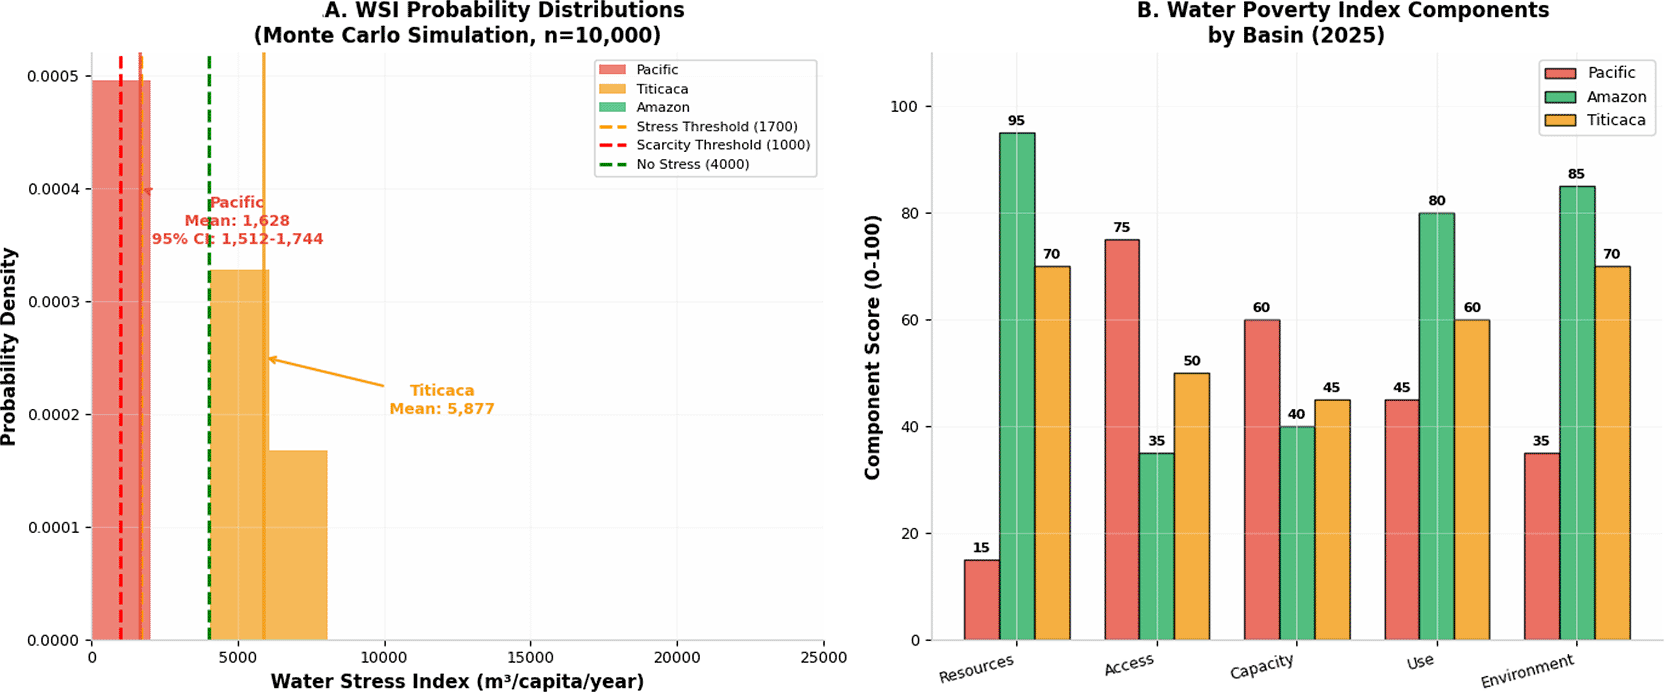
(A) Monte Carlo simulation (n = 10,000) showing WSI probability distributions for Pacific (red), Amazon (green), and Titicaca (orange) basins with 95% confidence intervals. Dashed vertical lines indicate Falkenmark thresholds: scarcity (1,000 m3/capita/year), stress (1,700 m3/capita/year), and no stress (4,000 m3/capita/year). Pacific basin mean WSI: 1,628 (95% CI: 1,512–1,744). Amazon basin mean WSI: 183,142 (95% CI: 155,171–211,113). (B) Water Poverty Index components by basin (0–100 scale, higher = better). Pacific basin shows low Resources scores (15) but high Access (75); Amazon basin shows inverse pattern with high Resources (95) but lower Access (35).
Peru’s asymmetry ratio (AR = 112.5) exceeds comparable cases ( Table 2):
Peru’s AR is 2.3× Egypt’s, 14× China’s, and 19× Spain’s. Unlike these nations, Peru has not implemented major inter-basin transfer infrastructure or comprehensive demand management programmes.
The Water Poverty Index (WPI) components reveal divergent challenges ( Figure 1B). The Pacific basin scores poorly on “Resources” (physical availability) but well on “Access” (infrastructure); the Amazon basin shows inverse patterns. This suggests that water poverty in Peru is driven by physical scarcity in the Pacific and economic scarcity (infrastructure deficits) in the Amazon.
Mann-Kendall tests reveal significant deteriorating trends in Pacific basin indicators ( Table 3):
The Pacific basin WSI declined from 2,450 m3/capita/year (1990) to 1,628 m3/capita/year (2025), a 33.6% reduction. At current trends (Sen’s slope: −18.4/year), absolute scarcity (<1,000) will be reached by 2059 (95% CI: 2048–2071).
National water consumption (96,593 hm3/year) shows sectoral distribution ( Figure 2A):
• Energy (non-consumptive): 59,936 hm3/year (62.1%)
• Agriculture (consumptive): 32,011 hm3/year (33.1%)
• Industry (consumptive): 2,753 hm3/year (2.9%)
• Domestic (consumptive): 1,887 hm3/year (2.0%)
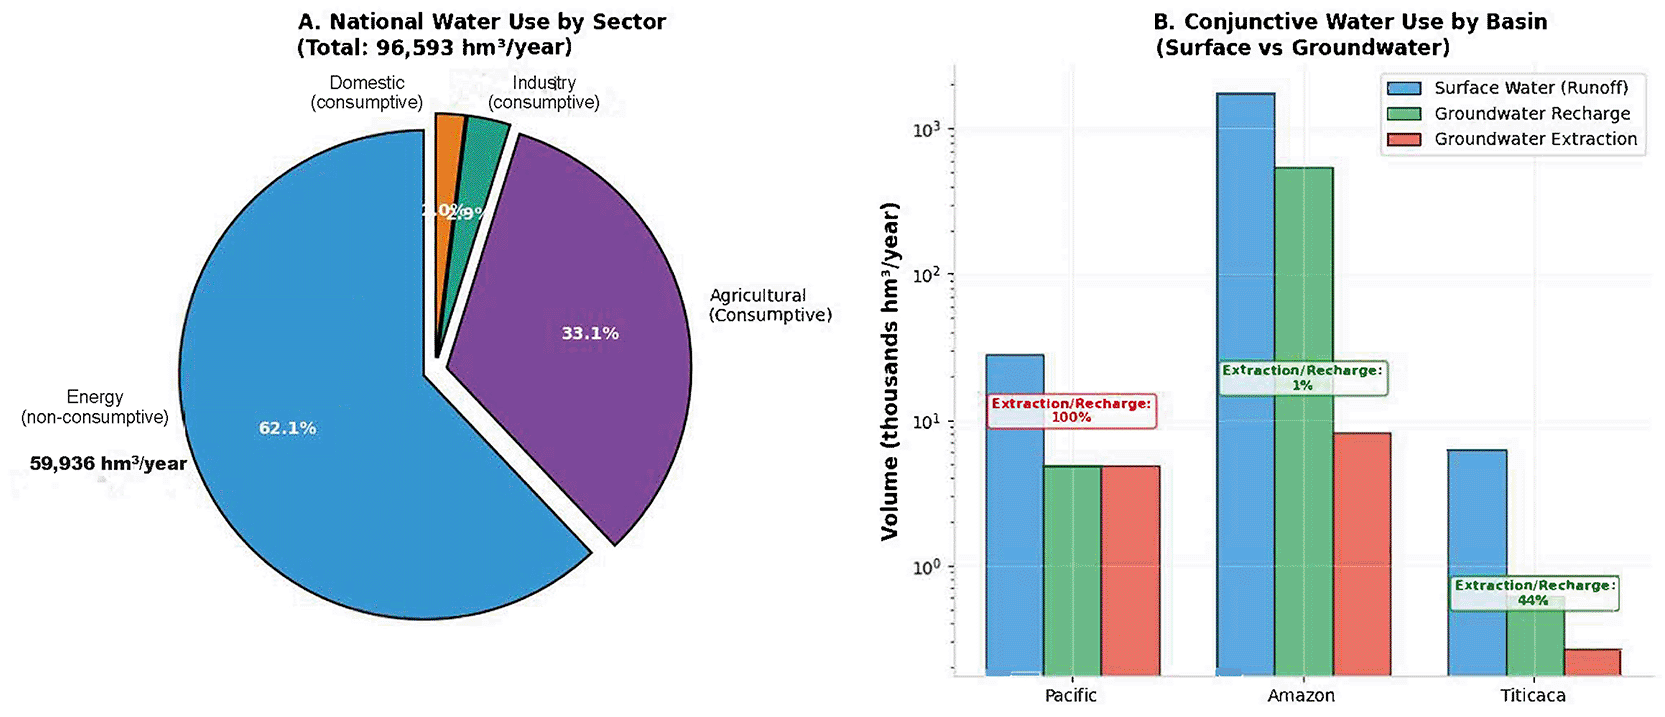
(A) Sectoral water use distribution (total 96,593 hm3/year). Energy use dominates (62.1%, non-consumptive), followed by agriculture (33.1%, consumptive), industry (2.9%), and domestic use (2.0%). (B) Conjunctive water use by basin showing surface water (runoff ), groundwater recharge, and groundwater extraction. Pacific basin extraction/recharge ratio: 100% (unsustainable). Amazon basin ratio: 1% (sustainable). Titicaca basin ratio: 44%.
Agricultural water productivity (AWP) shows minimal inter-basin variation (Pacific: 76.0 ha/million m3; Amazon: 78.5; Titicaca: 79.6), suggesting that efficiency differences do not drive pressure disparities. Instead, the absolute resource constraint in the Pacific basin (36,804 hm3 vs. 1,893,055 hm3 in Amazon) creates stress despite similar productivity.
Groundwater-surface water interactions reveal conjunctive use patterns ( Figure 2B). The Pacific basin extracts 4,844 hm3/year groundwater recharge (100% of renewable recharge), indicating unsustainable mining of fossil aquifers in coastal areas. The Amazon basin utilises only 1.5% of rechargeable groundwater.
Economic compensation collections (S/205.5 million) show inequitable distribution ( Table 4):
The Pacific basin generates 86× more compensation per unit of water availability than the Amazon basin (S/3.45 vs. S/0.04 per hm3). This inverse relationship between resource abundance and economic contribution indicates that compensation mechanisms tax scarcity rather than value ecosystem services.
Groundwater charges (S/32.5 million) are concentrated in the Pacific basin (74.8%), reflecting unsustainable extraction. Discharge fees (S/41.3 million) are split between Pacific (44.1%) and Amazon (54.2%), indicating pollution externalities in both basins.
Political ecology analysis reveals three structural barriers:
Accumulation by Dispossession: Historical water rights allocation (1930s–1970s) concentrated 68% of Pacific basin surface water rights in 12 large agricultural export enterprises (sugar, rice, asparagus), whilst 450,000 smallholders share 23%.31 This legacy constrains current reallocation options.
Scalar Mismatch: Watershed boundaries (159 hydrological units) intersect with 25 administrative regions and 1,874 municipal districts. The ANA’s basin-scale authority conflicts with regional government jurisdiction over infrastructure investment, creating coordination failures.32
Knowledge Exclusion: Indigenous water management systems (comunidades campesinas, ayllus) maintain parallel governance structures in 34% of Andean watersheds. State IWRM planning excludes these systems, reducing implementation legitimacy.33
This study demonstrates that Peru’s water crisis is not characterised by national scarcity but by extreme hydrological asymmetry. While national renewable availability exceeds 56,000 m3/capita/year, the Pacific basin remains below the Falkenmark water stress threshold (1,700 m3/capita/year), with Monte Carlo simulations confirming structural stress even under optimistic scenarios. This confirms that aggregated national indicators obscure subnational vulnerability, a limitation previously identified in global water security assessments.1,7,19
The asymmetry ratio calculated for Peru (AR = 112.5) substantially exceeds comparable international cases, including Egypt, China, Spain and the United States. Countries facing lower asymmetry ratios have implemented large-scale structural responses such as inter-basin transfers (China’s South–North Water Transfer), virtual water trade (Egypt), or binding allocation compacts (Colorado River Compact).10,28,31 Peru, by contrast, has not adopted a systemic redistribution strategy. This absence is particularly notable given that hydroclimatic studies project significant runoff reductions in glacier-fed Pacific basins under climate change scenarios.23,26 Without structural intervention, current declining trends in the Pacific basin WSI suggest that absolute scarcity (<1,000 m3/capita/year) could be reached within decades.
The Water Poverty Index (WPI) results further nuance this diagnosis. The Pacific basin scores poorly on the “Resources” component but relatively well on “Access”, reflecting infrastructure concentration. Conversely, the Amazon basin exhibits abundant physical resources but weaker infrastructure and service provision. This duality aligns with conceptual distinctions between physical and economic water scarcity.1,3 It also highlights that IWRM implementation in Peru has focused more strongly on allocation and regulation than on territorial equity and infrastructure balancing.7,34
Groundwater dynamics intensify these concerns. The Pacific basin currently exploits 100% of estimated renewable recharge, suggesting mining of fossil aquifers in coastal zones. Recent satellite gravimetry studies confirm long-term groundwater depletion trends in Peru’s arid basins.31 This pattern is emblematic of what hydrosocial cycle scholarship describes as the socio-political production of scarcity: institutional arrangements and economic priorities shape patterns of extraction beyond hydrological limits.30 In contrast, the Amazon basin utilises only a fraction of its renewable groundwater, reflecting infrastructural constraints rather than hydrological deficit.
Economic compensation mechanisms reveal a further structural paradox. The Pacific basin generates 86 times more compensation revenue per unit of available water than the Amazon basin. Current pricing instruments therefore internalise scarcity costs but fail to recognise ecosystem service provision. Payment for ecosystem services (PES) schemes implemented in Andean headwaters, such as those in the Santa River basin, illustrate how upstream conservation can be economically valued.33 However, these initiatives remain geographically limited and financially marginal relative to national compensation flows. Aligning compensation schemes with ecosystem service valuation principles could reduce territorial inequities while strengthening adaptive capacity.
The governance barriers identified—accumulation by dispossession, scalar mismatch, and knowledge exclusion—are consistent with documented limitations in Peruvian IWRM implementation.7,14,35 Historical water rights concentration constrains redistribution; overlapping administrative jurisdictions undermine basin-scale coordination; and indigenous governance systems remain insufficiently integrated into state planning frameworks.33 These structural constraints help explain why Peru, despite formal adoption of IWRM principles since 2009, has not achieved hydrological equity.
Taken together, the findings suggest that Peru’s water challenge is a governance asymmetry layered upon a hydrological asymmetry. Addressing it requires moving beyond infrastructure-centric responses toward integrated demand management, groundwater regulation, ecosystem service valuation, and multi-scalar institutional reform. Without such recalibration, climatic variability and demographic concentration will further entrench coastal scarcity while leaving Amazonian abundance underutilised and undervalued.
This study provides the first uncertainty-quantified, internationally benchmarked assessment of hydrological asymmetry in Peru. Four principal conclusions emerge:
1. Extreme subnational asymmetry: Peru exhibits one of the highest recorded asymmetry ratios globally (AR = 112.5), with the Pacific basin structurally water-stressed despite national abundance.
2. Divergent scarcity typologies: The Pacific basin experiences physical scarcity, whereas the Amazon basin faces economic and infrastructural scarcity, consistent with global water poverty frameworks.1,3,28
3. Unsustainable groundwater exploitation: Full utilisation of renewable recharge in the Pacific basin signals long-term depletion risks, corroborated by recent geodetic evidence.31
4. Misaligned economic instruments: Current compensation mechanisms disproportionately tax scarcity without valuing ecosystem services, reinforcing territorial inequities.
Policy implications follow directly from these findings. First, basin-scale demand management and irrigation efficiency improvements are imperative in the Pacific basin. Second, groundwater monitoring and abstraction control must be strengthened to prevent irreversible depletion. Third, compensation mechanisms should incorporate ecosystem service valuation principles, redistributing revenues toward hydrologically strategic headwater regions. Finally, effective IWRM requires institutional integration across administrative scales and recognition of indigenous water governance systems.
Peru’s case illustrates a broader lesson for water-rich yet spatially uneven nations: aggregate abundance does not guarantee water security. Without institutional mechanisms that reconcile hydrology, demography, and political economy, asymmetry becomes a driver of chronic stress. Future research should prioritise high-resolution groundwater mapping, climate scenario modelling, and evaluation of compensation redistribution impacts to support evidence-based reform.
All data supporting this study are publicly available from:
The project contains the following underlying data:
○ Table 1_Water_supply_population_by_sources.xlsx (Population distribution and water resources by basin: Pacific, Amazon, and Titicaca; INEI Census 2017 and 2025 projections)
○ Table 2_Hydrological_cycle_parameters.xlsx (Hydrological cycle parameters: precipitation, evapotranspiration, aquifer recharge, and runoff by basin)
○ Table 3_Sectoral_water_use_pressure.xlsx (Sectoral water use: agricultural, industrial, population, and energy; degree of pressure on water resources)
○ Table 4_Economic_compensation_water.xlsx (Economic compensation for water use by basin and category: agrarian, non-agrarian, groundwater, and discharge)
Data are available under the terms of the Creative Commons Zero “No rights reserved” data waiver (CC0 1.0 Public domain dedication).36
We thank Universidad Nacional Toribio Rodríguez de Mendoza de Amazonas for institutional support and We acknowledge the National Water Authority (ANA) and National Institute of Statistics (INEI) for open data provision.
The author(s) declared that no grants were involved in supporting this work.
© 2026 Suarez Rivadeneira JE et al. This is an open access article distributed under the terms of the Creative Commons Attribution License, which permits unrestricted use, distribution, and reproduction in any medium, provided the original work is properly cited.
Current Reviewer Status: ?
Key to Reviewer Statuses VIEW HIDE
ApprovedThe paper is scientifically sound in its current form and only minor, if any, improvements are suggested
Approved with reservations A number of small changes, sometimes more significant revisions are required to address specific details and improve the papers academic merit.
Not approvedFundamental flaws in the paper seriously undermine the findings and conclusions
Version 1
VERSION 1
PUBLISHED 30 Mar 2026
Reviewer Report 08 Aug 2026
Elmer Calizaya, Universidad Nacional del Altiplano, Puno, Puno, Peru
Approved
VIEWS 0
Does the paper provide a comprehensive overview of the policy and the context of its implementation in a way which is accessible to a general reader?
Yes
Is the discussion on the implications clearly and accurately presented and does it cite the current literature?
Yes
Are the recommendations made clear, balanced, and justified on the basis of the presented arguments?
Partly
Competing Interests: No competing interests were disclosed.
Reviewer Expertise: Hydrology, Water Resources, Geomatics, Geographic Information System, Climate Change.
CloseReviewer Report 30 Jul 2026
Edgar Virgilio Bedoya Justo, Universidad Nacional de Moquegua, Perane, Moquegua, Peru
Approved
VIEWS 0
Does the paper provide a comprehensive overview of the policy and the context of its implementation in a way which is accessible to a general reader?
Yes
Is the discussion on the implications clearly and accurately presented and does it cite the current literature?
Yes
Are the recommendations made clear, balanced, and justified on the basis of the presented arguments?
Yes
Competing Interests: No competing interests were disclosed.
Reviewer Expertise: Environment and sustainable development
Close