Просмотр новости
Найдите то, что Вас интересует
 Спутники
 РН
РН SpaceX
 Роскосмос
 NASA
NASA
СпутникиРНSpaceXРоскосмосNASABackground Breast cancer remains one of the leading causes of cancer-related mortality worldwide, and the emergence of drug resistance, systemic toxicity, and limited efficacy of current therapies highlight the need for safer and more effective treatment. Natural products have emerged as promising sources of multi-target anticancer agents. A. cardamomum has demonstrated preliminary anticancer potential, yet the bioactive constituents and their molecular mechanisms in breast cancer remain poorly elucidated. Methods This study integrated in silico approaches to investigate the therapeutic potential of A. cardamomum seed extract against breast cancer. LC–MS analysis identified phytochemical compounds, followed by network pharmacology to determine their potential targets and molecular pathways. Pharmacokinetic and toxicity predictions were assessed through ADMET and Lipinski’s rule of five analyses to evaluate drug-likeness and safety. Molecular docking and molecular dynamics (MD) simulations were conducted to evaluate binding affinity and structural stability of compounds with key oncogenic proteins. Results LC-MS profiling identified 22 distinct compounds in A. cardamomum seeds. ADMET and Lipinski analyses demonstrated that most compounds possessed high gastrointestinal absorption, favorable oral bioavailability, and low toxicity risk. Network pharmacology highlighting SRC, TNF-α, Caspase-3, and EGFR as central nodes in the protein-protein interaction network. Molecular docking identified compounds C17 and C20 as the most promising bioactives, showing strong binding affinities and interactions similar to control ligands. MD simulations confirmed their stable complexes, indicating conformational stability and robust ligand–protein interactions. Conclusion This study highlights the promising multi-target anticancer potential of A. cardamomum seeds. Compounds C17 and C20 were identified as lead candidates with strong and stable interactions with key breast cancer-related proteins and favorable pharmacokinetic properties. These results suggest that A. cardamomum could serve as a potential source for developing new plant-based therapies against breast cancer. Further in vitro and in vivo investigations are warranted to validate their efficacy and safety.
3.1.1 Liquid Chromatography-Mass Spectrometry (LC-MS) analysis
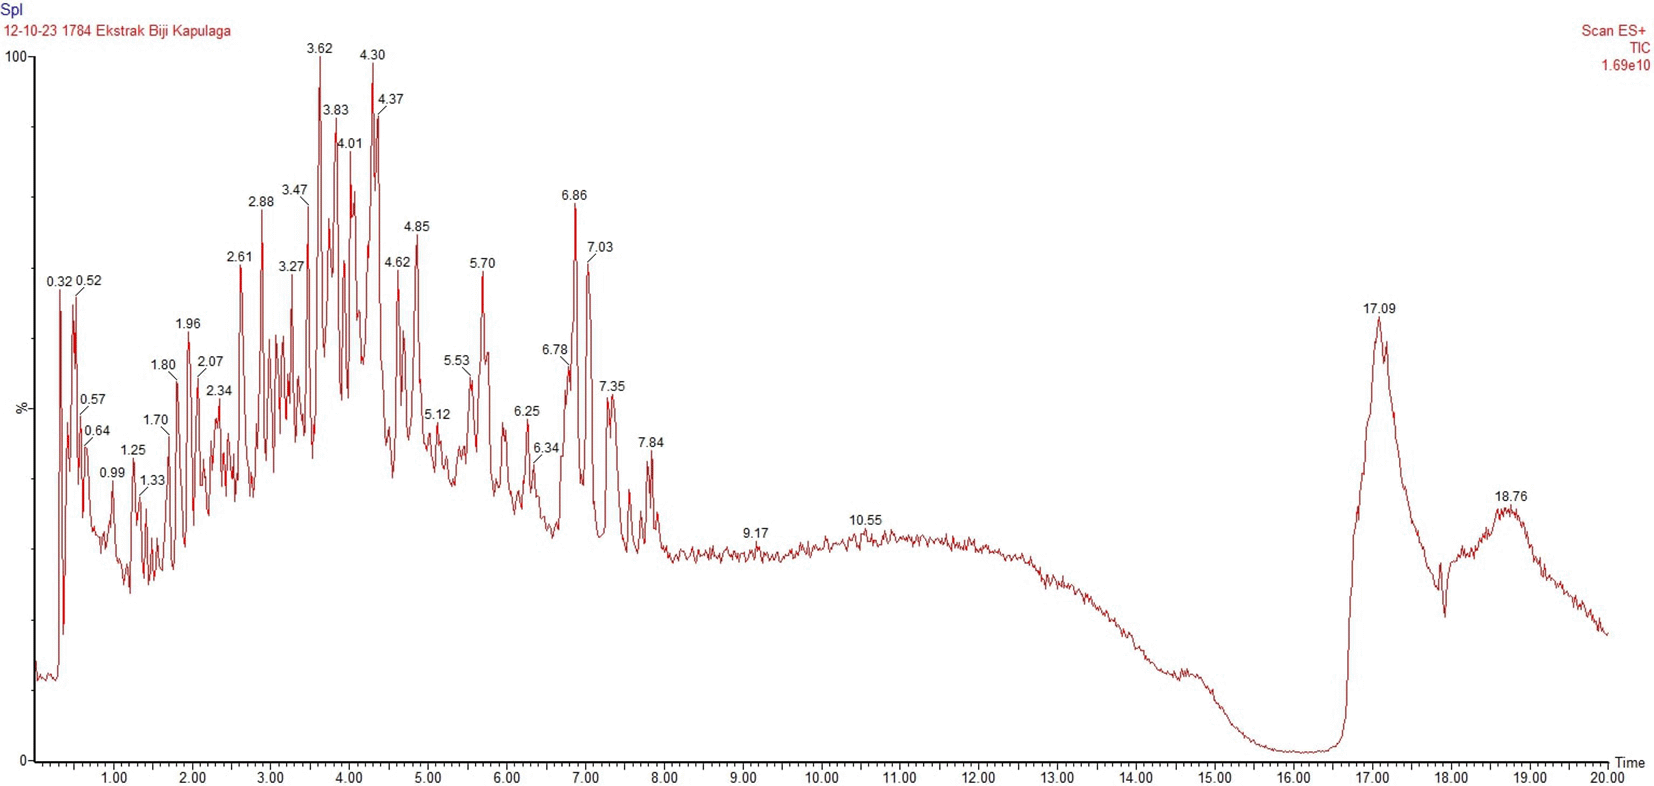
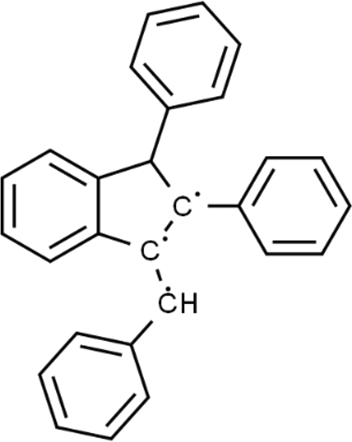
The LC-MS analysis of Amomum cardamomum seed extract identified 22 unique compounds ( Figure 1, Table 2). These compounds exhibit diverse molecular weights, retention times, and polarities, reflecting the chemical complexity of the extract. The retention times ranged from 0.52 to 17.09 minutes, and molecular weights varied between 113.115 Da (ethyl cyanoacetate) and 369.161 Da (1,2-diphenyl-3-(phenylmethyl)-1H-indene), highlighting the presence of both small and larger molecules.
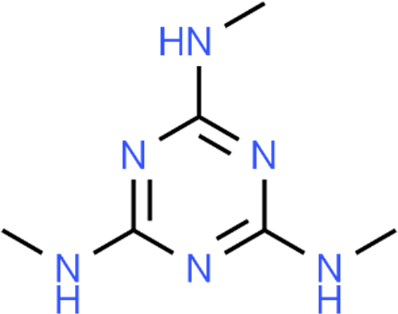
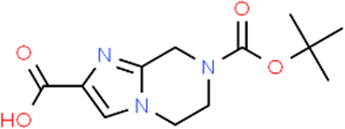 C22,4,6-trimethylmelamine0.994169.1202C6H12N6168.200
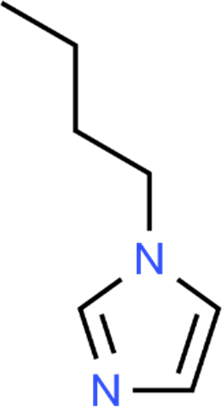
 C31-Butyl-1H-imidazol 1-Butylimidazole1.281123.0949C7H12N2124.184
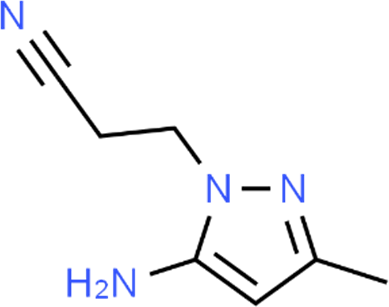
 C43-(5-Amino-3-methyl-pyrazole-1-yl)-propionitrile1.702151.1024C7H10N4150.181
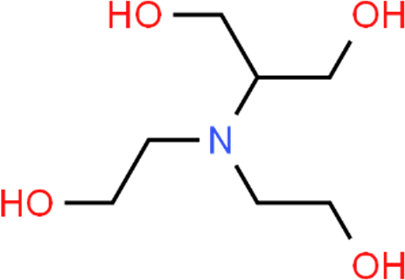
 C52-[Bis(2-hydroxyethyl)amino]propane-1,3-diol1.803180.1216C7H17NO4179.214
 C61,2-diphenyl-3-(phenylmethyl)-1H-indene 1.955369.1614C28H21357.466
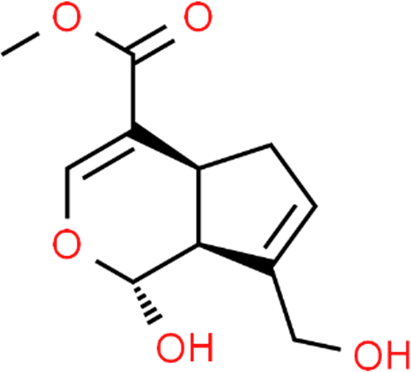
 C7Genipin2.073227.0964C11H14O5226.226
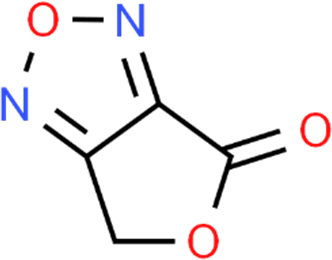
 C84H,6H-Furo[3,4-c][1,2,5]oxadiazol-4-one2.343127.0147C4H2N2O3126.070
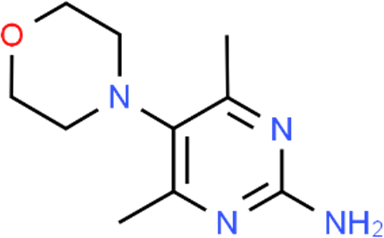
 C94,6-Dimethyl-5-morpholin-4-ylpyrimidin-2-amine2.596209.1409C10H16N4O208.260
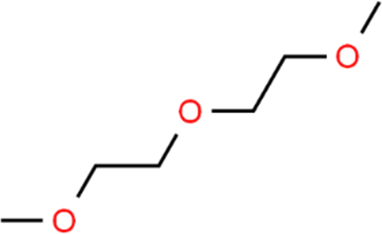
 C10diglyme2.916135.1071C6H14O3134.174
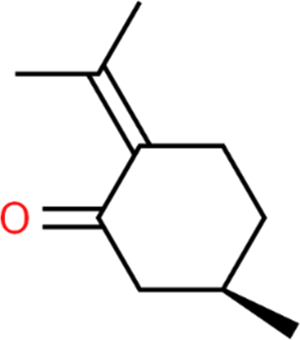
 C11(R)-(+)-Pulegone3.270153.1255C10H16O152.233
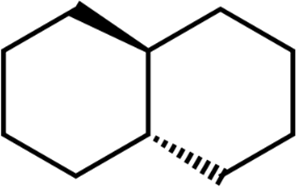
 C12trans-decalin 3.472139.1534C10H18138.250
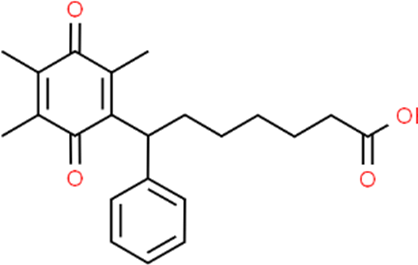
 C13Seratrodast3.624355.1887C22H26O4354.439
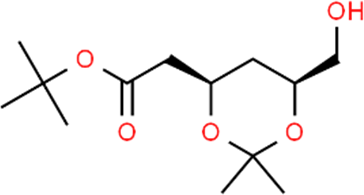
 C14tert-butyl 2,4-dideoxy-3,5-O-(1-methyl ethylidene)-D-erythro-hexonate 3.826261.1739C13H24O5260.327
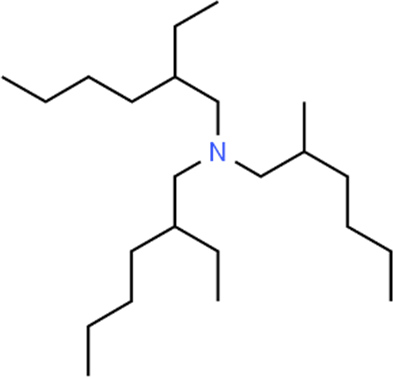
 C152-Ethyl-N,N-bis(2-ethylhexyl) hexylamine4.012340.3940C23H49N339.642
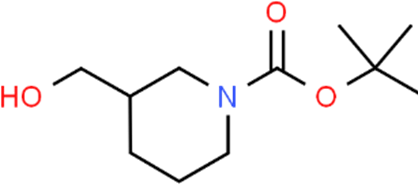
 C16N-Boc-piperidine-3-methanol4.315216.1587C11H21NO3215.289
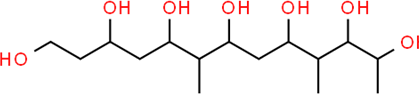
 C176,10-Dimethyl-1,3,5,7,9,11,12-tridecaneheptol4.871325.2201C15H32O7324.410
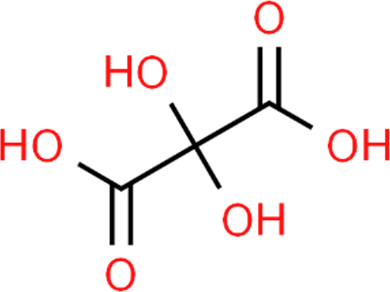
 C18Dihydroxymalonic acid5.697137.0670C3H4O6136.060
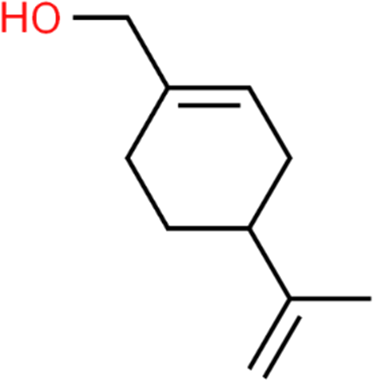
 C19Perillic alcohol6.254153.0623C10H16O152.233
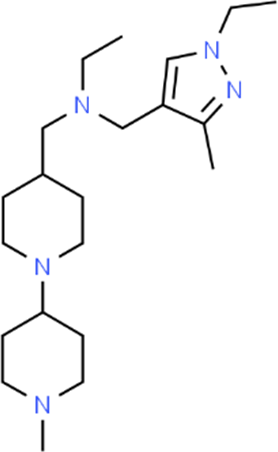
 C20N-[(1-Ethyl-3-methyl-1H-pyrazole-4-yl)methyl]-N-[(1'-methyl-1,4'-bipiperidin-4-yl)methyl]ethanamine6.860362.3331C21H39N5361.568
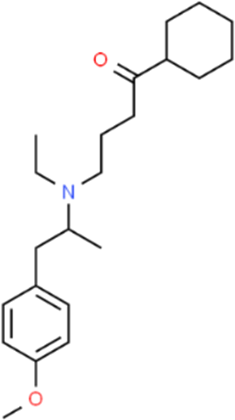
 C21Secoverine7.838346.2740C22H35NO2345.519
 C22Ethyl cyanoacetate17.092114.0541C5H7NO2113.115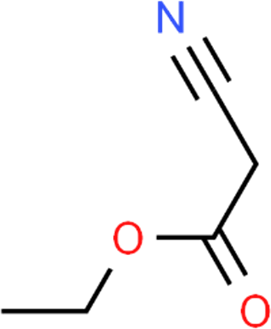
3.2.1 Protein-protein interaction network analysis
A total of 335 protein targets were identified from SwissTargetPrediction, whereas 150 targets were obtained from SEA analysis. Disease-associated gene mining retrieved 20,521 breast cancer-related genes from GeneCards and 41,282 genes from CTD. Venn intersection analysis identified 36 overlapping targets shared between the compound- and disease-related datasets, which were subsequently selected for downstream network analysis (Figure 2a). The 36 common targets were imported into STRING to construct the protein–protein interaction (PPI) network. The network showed dense interactions among proteins associated with inflammatory signaling, apoptosis, kinase regulation, and matrix remodeling pathways, indicating that the bioactive compounds of A. cardamomum may act through multiple interconnected biological mechanisms rather than a single target (Figure 2b). Several proteins demonstrated high interaction connectivity, particularly TNF, SRC, EGFR, CASP3, PIK3CA, and JAK1, suggesting their important roles in the predicted anti-breast-cancer activity of the identified compounds (Figure 3c).
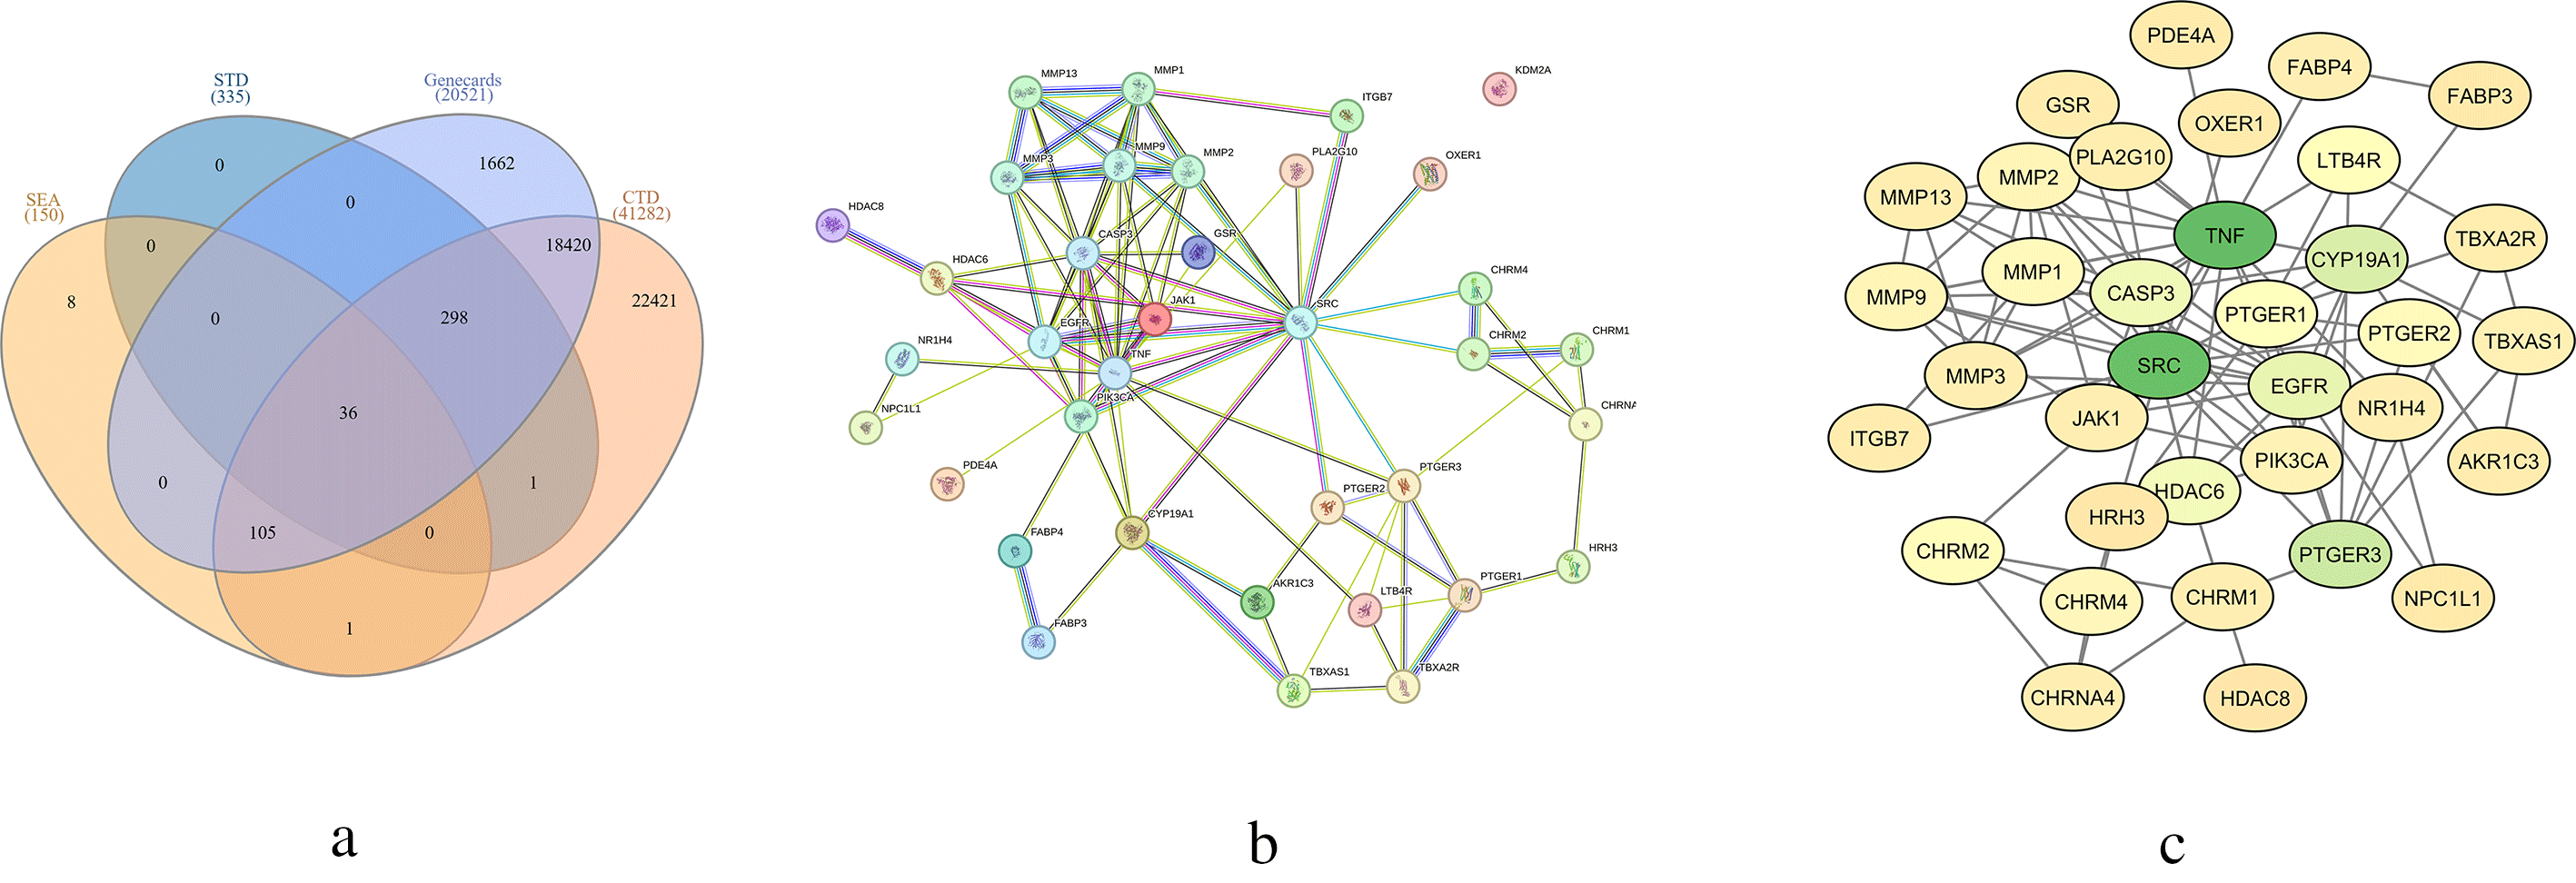
(a) Venn diagram showing the overlap between compound-related and breast cancer-related targets, identifying 36 common genes; (b) PPI network of the overlapping targets; and (c) Topological analysis of PPI network highlighting hub nodes.
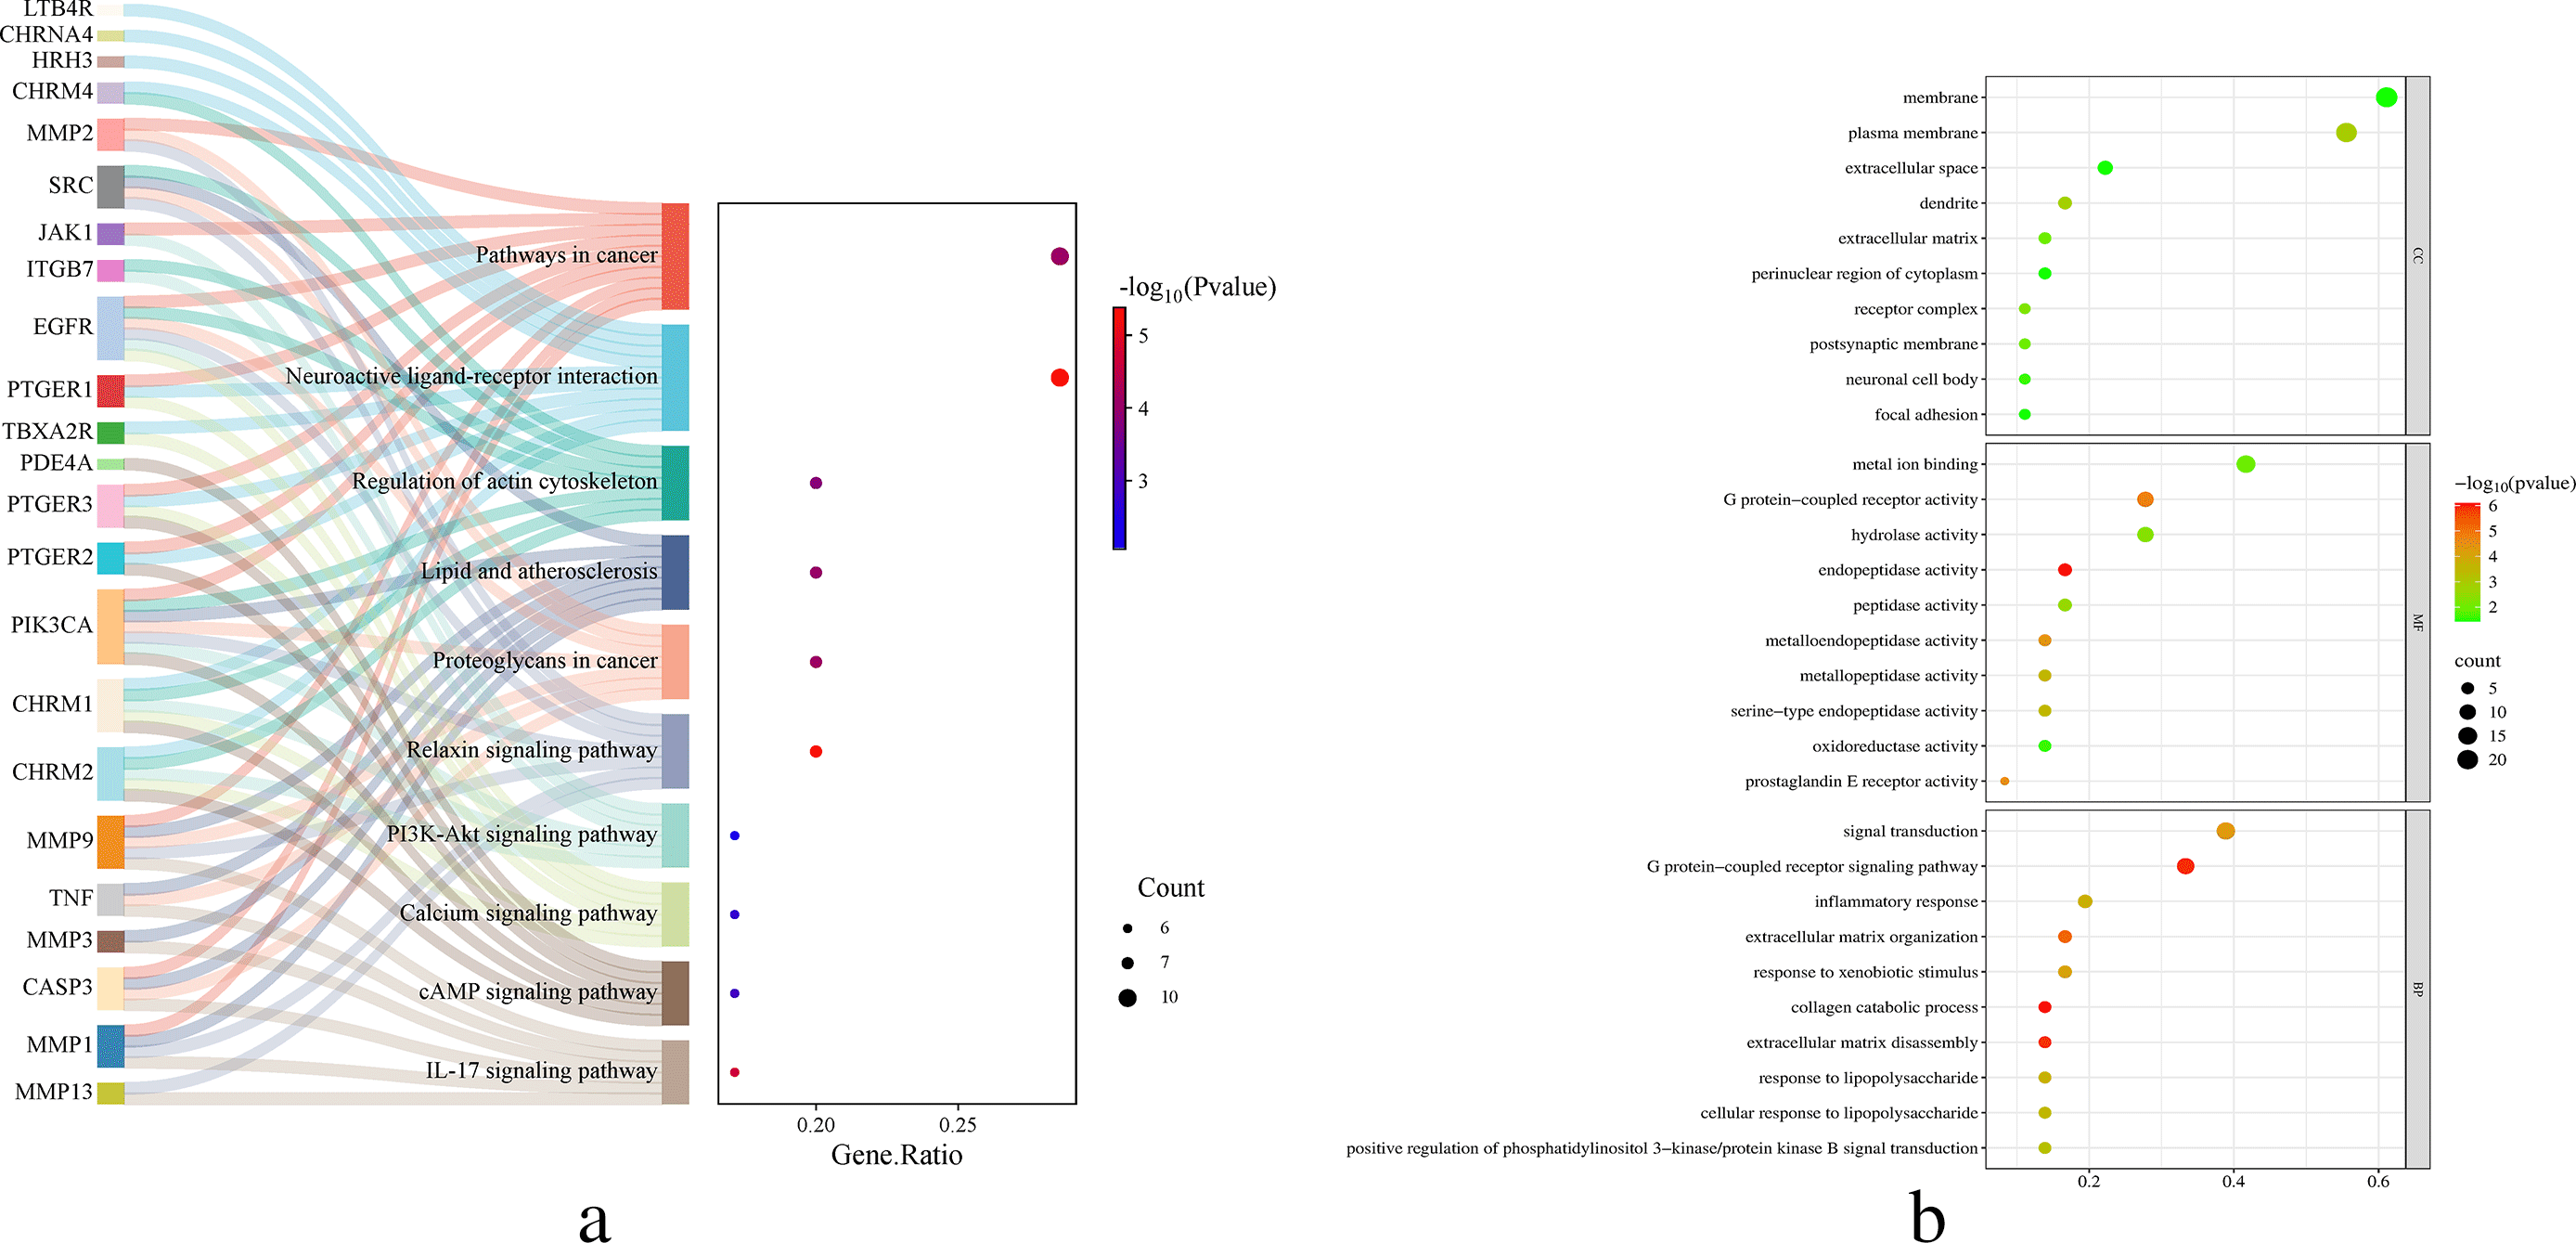
(a) network depicting association between enriched pathways and genes; and (b) biological process (BP), cellular component (CC), and molecular function (MF)).
Topological analysis using CytoNCA followed by PCA-based overall centrality scoring identified TNF as the highest-ranked hub protein with an overall score of 28.35, followed by SRC (27.13), EGFR (4.39), and CASP3 (2.87) (Table 3).
3.2.2 GO and KEGG enrichment
Functional enrichment analysis demonstrated that the overlapping targets were significantly involved in multiple cancer-related and inflammatory signaling pathways. KEGG pathway analysis revealed that the identified genes were predominantly enriched in pathways associated with cancer, neuroactive ligand–receptor interaction, regulation of the actin cytoskeleton, lipid and atherosclerosis, proteoglycans in cancer, relaxin signaling pathway, PI3K–Akt signaling pathway, calcium signaling pathway, cAMP signaling pathway, and IL-17 signaling pathway. Among these, pathways in cancer and neuroactive ligand–receptor interaction exhibited the highest gene ratios and enrichment significance (Figure 3a).
As illustrated in Figure 3b, GO enrichment analysis further demonstrated that the shared targets were associated with diverse biological processes, molecular functions, and cellular components. In the BP category, the enriched terms mainly included signal transduction, G protein–coupled receptor signaling pathway, inflammatory response, extracellular matrix organization, collagen catabolic process, and positive regulation of PI3K/AKT signaling. MF analysis showed enrichment in metal ion binding, G protein–coupled receptor activity, hydrolase activity, endopeptidase activity, and oxidoreductase activity. In the CC category, the targets were primarily localized to the membrane, plasma membrane, extracellular space, extracellular matrix, receptor complex, and focal adhesion. Collectively, these findings suggest that the predicted targets may regulate breast cancer progression through coordinated modulation of inflammatory signaling, extracellular matrix remodeling, receptor-mediated communication, and oncogenic PI3K–Akt-related pathways.
3.2.3 Pharmacokinetic and pharmacodynamic analysis of A. cardamomum compound
The pharmacokinetic and pharmacodynamic analysis of the 22 compounds identified in A. cardamomum seed extract revealed several key findings regarding their drug-likeness and potential therapeutic application.
3.2.3.1 Absorption, distribution, metabolism, excretion, and toxicity (ADMET) analysis
The pharmacokinetic evaluation ( Table 4) revealed that most compounds from A. cardamomum seeds were predicted to have good gastrointestinal absorption, suggesting favorable uptake following oral administration. Only a few compounds, including C5, C7, C15, and C18, showed low absorption potential, indicating possible limitations in bioavailability. Consistent with these findings, nearly all compounds exhibited adequate oral bioavailability, suggested favorable pharmacokinetic properties. Interestingly, several molecules, such as C1, C3, C11-C14, C16, C19-C21, were also predicted to penetrate the blood–brain barrier, raising the possibility of central nervous system activity.
In terms of metabolism, the majority of compounds were not identified as substrates or inhibitors of cytochrome P450 2D6 (CYP2D6), which reduces the likelihood of extensive enzyme-mediated clearance or drug–drug interactions. Notably, C15 was predicted to act as a substrate, while C21 displayed inhibitory potential, highlighting that these particular molecules may influence or be influenced by drugs processed through CYP2D6.
Excretion analysis indicated that almost all compounds were unlikely to interfere with renal elimination pathways. Only C15 was predicted to be an OCT2 substrate, suggesting that most A. cardamomum constituents are unlikely to affect the renal clearance of co-administered drugs.
Regarding solubility, the majority of compounds showed adequate water solubility, ranging from moderate to very soluble, which is advantageous for formulation and bioavailability. However, two compounds, C6 and C15, were categorized as poorly soluble, which could limit their practical application unless addressed by formulation strategies. Together, these findings suggest that the chemical profile of A. cardamomum seeds is largely consistent with drug-likeness criteria, although specific molecules may require optimization to overcome solubility or metabolic limitations.
3.2.3.2 Lipinski’s rules of five
Lipinski’s rule of five indicates that 20 of the 22 evaluated compounds meet the criteria for drug-likeness compounds (Table 5). However, two compounds, C15 and C18, do not fully adhere to these criteria. C15 exhibits noncompliance due to the consensus log P value >5 (6.964573) and molar refractivity >130 (130.880981), which indicates potential challenges related to excessive lipophilicity and molecular size. LogP value indicates the level of lipophilicity, where high lipophilicity can result in quickly metabolized compounds, low solubility, and poorly absorbed (Rutkowska et al., 2013). Molar refractivity values within the range of 40-130 suggest that a substance is likely to have good intestinal absorption and oral bioavailability (Ya’u Ibrahim et al., 2020). Conversely, C18 fails to meet the criteria because of its H-bond receptor count >5 (6) and molar refractivity <40 (17.236599), indicating potential issues with polarity and molecular size. The H-bond acceptor and H-bond donor present in the structure of a therapeutic agent play a vital role in membrane transport, drug-protein interactions, distribution, and aqueous solubility (Kenny, 2022). This evaluation provides valuable insights into the drug-like potential of the compounds from A. cardamomum.
3.2.3.3 Toxicity prediction
Based on the results of the toxicity analysis ( Table 6), three compounds, namely C6, C7, and C14, were found to be in the toxic level (class I-III). Overall, one compound (C14) is classified as class two toxicity (fatal by ingestion (5 < LD50 ≤ 50)), two compounds (C6 and C7) are classified as class III toxicity (toxic by ingestion (50 < LD50 ≤ 300)), twelve compounds (C1, C2, C4, C5, C8, C9, C11, C13, C15, C16, C20, and C21) are classified as class IV toxicity (harmful if swallowed (300 < LD50 ≤ 2000)), six compounds (C3, C10, C17, C18, C19, and C22) are classified as class V toxicity (may be harmful if swallowed (2000 < LD50 ≤ 5000)), and one compound (C12) are classified as class VI toxicity (non-toxic (LD50 > 5000)). Based on the analysis of organ toxicity, only 1 out of 22 compounds (C2) was reported to be active in the hepatotoxicity category. In the next category, 7 compounds (C4, C5, C6, C8, C10, C12, and C22) were reported as active carcinogenicity. Two out of 22 compounds (C4 and C8) were reportedly active in the mutagenicity. All evaluated compounds did not exhibit immunotoxicity or cytotoxicity. This is a positive sign that these compounds may not always risk genetic or cell damage, even if they are considered detrimental or possibly hazardous based on LD50 values [3]. Therefore, even if the chemicals from A. cardamomum have a variety of toxicity profiles, any prospective medicinal or pharmacological application must consider the unique risk factors associated with each component. Moreover, in vivo investigations are necessary to validate these in silico results and offer a more thorough comprehension of the safety and effectiveness of these substances.
3.2.4 Molecular docking
The molecular docking analysis was conducted using the MOE application. To carry out a targeted molecular docking analysis, the grid box is accurately placed at the active site of each target protein. The grid box settings in the MOE application’s Site Finder feature were automatically modified according to the amino acid residues corresponding to the natural ligand of each protein. Molecular docking results include binding affinity (measured in kcal/mol), RMSD (Å), and visualization in two and three dimensions. A compound with an RMSD below 2.5 Å and a more favorable binding affinity (more negative) than the control ligand may indicate promising binding potential toward the target protein ( Table 7).
3.2.4.1 Molecular docking of SRC protein
The molecular docking between SRC and A. cardamomum seed extract revealed that the compounds have RMSD values below 2Å. Based on the binding affinity, C20 exhibited the most favorable binding affinity (-8.58 kcal/mol), which was lower than that of the control ligand (-7.89 kcal/mol) ( Table 7). C20 formed three interactions: one acidic hydrophilic (Asp404) and two greasy hydrophobic interactions (Ala390 and Phe405). Control ligand formed three interactions: one acidic hydrophilic (Asp404), one basic hydrophilic (Arg388), and one greasy hydrophobic interaction (Val281). These results showed that C20 interacts with Asp404, the same amino acid residue with which the control ligand interacts ( Table 8). These findings suggest that C20 may interact favorably with the SRC active site and could be a candidate for further investigation.
3.2.4.2 Molecular docking of TNF-α protein
From the molecular docking result, C17 attaches to the TNF-α active site with minimal deviation, marked by RMSD < 2Å (1.41 Å). C17 (-6.91 kcal/mol) has a binding affinity close to the control ligand’s (-7.00 kcal/mol) ( Table 7). C17 formed three polar hydrophilic interactions: TyrC119, TyrA119 and TyrA151. Meanwhile, the control ligand formed two polar hydrophilic interactions: TyrA119 and TyrA151. These showed that C17 and the control ligand interact with two similar amino acid residues of TNF-α (TyrA119 and TyrA151) ( Table 9). Therefore, C17 demonstrated favorable binding interactions with the TNF-α active site and may be a candidate for further investigation.
3.2.4.3 Molecular docking of Casp3 protein
Based on the binding affinity, C17 exhibited the most favorable binding affinity among the compounds of A. cardamomum and the control ligand (-6.70 kcal/mol) ( Table 7). The 2D interaction visualization revealed that C17 formed three interactions with the active site of casp3: one basic hydrophilic (Arg207), one polar hydrophilic (Asn208), and one greasy hydrophobic (Trp214) interaction. On the other hand, casp3 inhibitors formed one basic hydrophilic (Arg207) and two polar hydrophilic interactions (Thr62, Ser209) with the active site of casp3. This result showed that C17 and casp3 inhibitors formed one similar interaction with the active site of casp3 (Arg207) ( Table 10). These interactions suggest that C17 may exhibit favorable binding toward the casp3 active site and warrant further investigation.
3.2.4.4 Molecular docking of EGFR protein
All compounds of Amomum cardamomum have RMSD values below 2 Å, except C15. Regarding binding affinity, C20 (-6.43 kcal/mol) has a binding affinity close to the control ligand (-6.47 kcal/mol) as the control ligand ( Table 7). Although the binding affinity of C20 was slightly lower than that of the control ligand, the values remained comparable. The 2D interaction visualization showed that C20 formed two acidic hydrophilic interactions with the active site of EGFR (Asp831 and Glu738). Although the binding affinity of C20 was slightly lower than that of the control ligand, the values remained comparable. The 2D interaction visualization showed that C20 formed two acidic hydrophilic interactions with the active site of EGFR (Asp831 and Glu738). Meanwhile, the control ligand formed one basic hydrophilic interaction (Lys721) and one greasy hydrophobic interaction (Phe699). Although C20 does not have identical amino acid residues as the control ligand, the 3D interaction visualization suggested that C20 may occupy a binding region similar to that of the control ligand on the EGFR active site ( Table 11).
3.2.5 Molecular dynamic simulation
Molecular dynamics simulations were performed to evaluate the structural stability of the protein–ligand complexes over a 50 ns time scale. The analysis focused on root mean square deviation (RMSD), radius of gyration (Rg), and solvent-accessible surface area (SASA) to assess the overall conformational stability and compactness of each system (Figure 4).
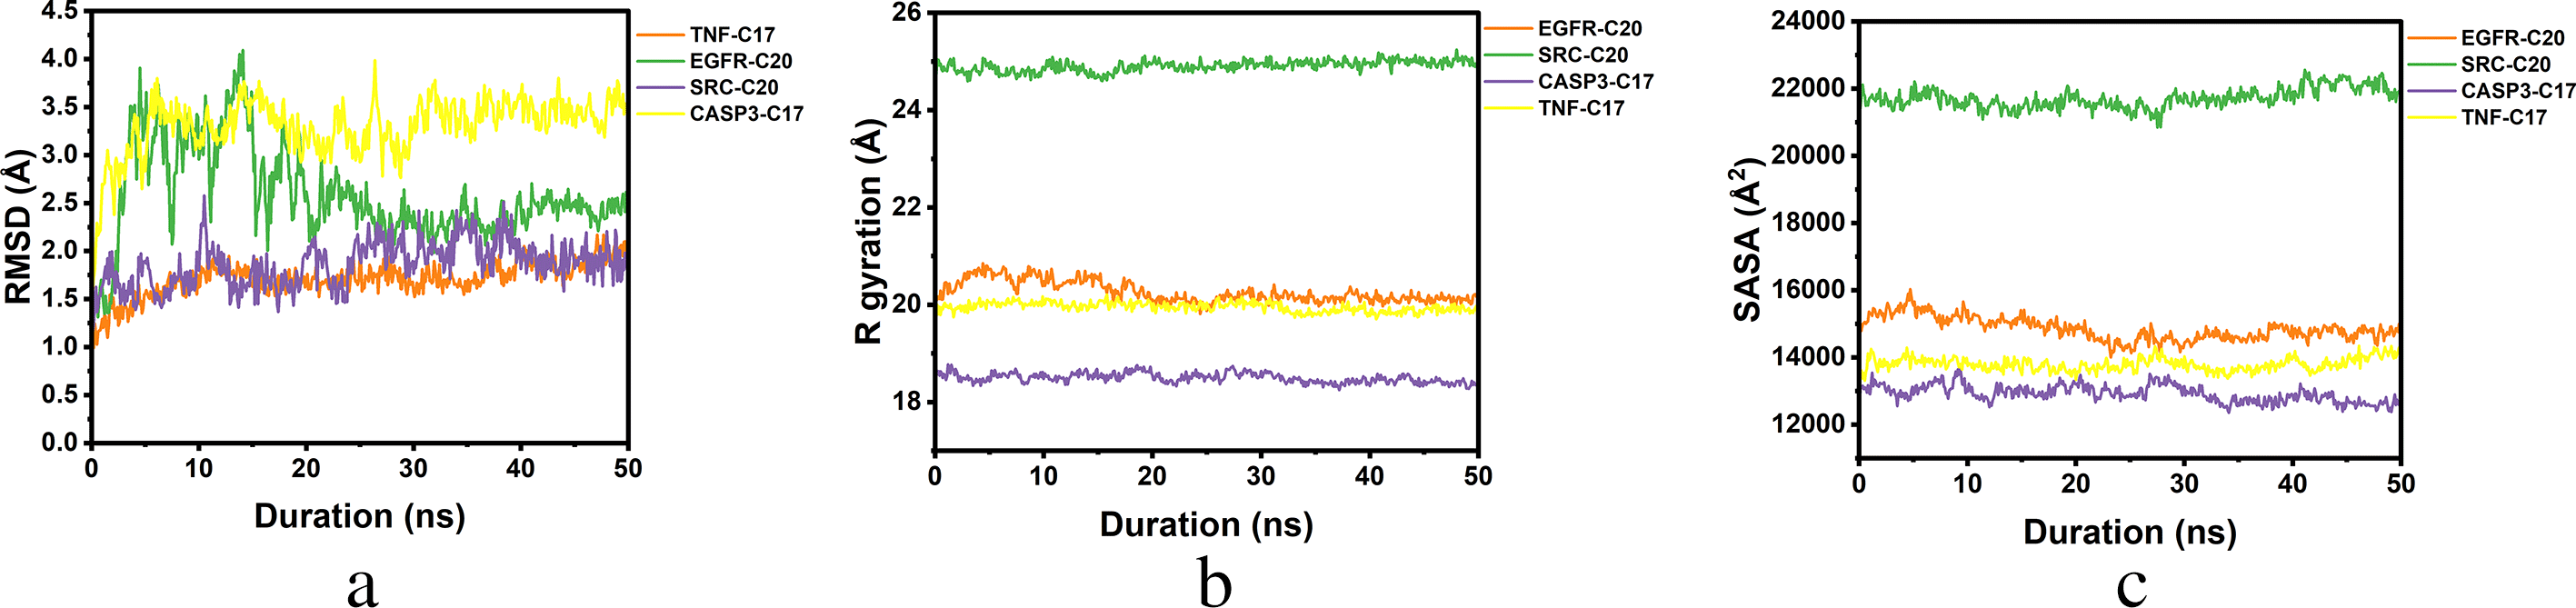
(a) RMSD; (b) R gyration; and (c) SASA.
The RMSD analysis (Figure 4a) indicates that TNFα–C17 exhibits stable behavior, with values consistently around 1.5–2.0 Å throughout the 50 ns simulation. SRC–C20 shows similar stability with RMSD values fluctuating around 1.5–2.0 Å, with slightly higher variation compared to TNFα–C17. EGFR–C20 demonstrates higher RMSD values (2.5–4.0 Å), with notable fluctuations during the first 25 ns before reaching a more stable plateau around 2.5 Å. CASP3–C17 shows relatively higher RMSD values ranging between 3.0–3.5 Å throughout the simulation period. Overall, all complexes reach a relatively stable state after approximately 25 ns, although each system exhibits different stability ranges.
Furthermore, the radius of gyration (Rg) analysis (Figure 4b) shows that all protein–ligand complexes maintain relatively consistent compactness throughout the simulation. CASP3–C17 displays the lowest Rg values, suggesting a more compact structure, while TNFα–C17 and EGFR–C20 show slightly higher but stable Rg profiles. SRC–C20 exhibits comparatively higher Rg values, indicating a relatively larger but stable structural conformation over time.
Moreover, the solvent-accessible surface area (SASA) results further indicate that all complexes maintain stable solvent exposure during the simulation period. SRC–C20 shows the highest SASA values, while CASP3–C17 exhibits the lowest SASA values among the four systems. TNFα–C17 and EGFR–C20 display intermediate SASA values, with no major fluctuations observed. Overall, RMSD, Rg, and SASA results collectively suggest that all complexes maintain structural stability under simulation conditions without large conformational disruptions.