Просмотр новости
Найдите то, что Вас интересует
 Спутники
 РН
РН SpaceX
 Роскосмос
 NASA
NASA
СпутникиРНSpaceXРоскосмосNASABackground Medicine is one of the largest and most impactful research disciplines worldwide. Evaluating both the quantity and quality of research output across countries can provide insights into research efficiency, productivity, and scientific impact. Methods Using Scival/Scopus, the research output of the top countries in medicine was analyzed for years 2000 to 2024. Both quantity and quality metrics, normalized to funds and human capita, were considered when assessing national research performance in medicine. Results The global research output in medicine increased by 2.6 folds although its share of the total global publications across all fields decreased by 6%. Considering quantities, USA has the highest number of publications, while China has the highest fold growth. Switzerland had the highest normalized values with 2,326 publications per million capita in 2024 and 432 publications per thousand researchers in 2021. Denmark performed the best with respect to Gross Domestic Product (GDP). China and Japan had the lowest number of publications per thousand researchers (74.4 and 68.3 in 2022, respectively). Recently, China, Japan, and the USA had only 0.42, 0.33, and 0.30 publication per million Gross Expenditures and Research and Development (GERD) in 2022, respectively. Considering quality, Netherlands consistently has publications in top percentile journals. All countries, expect China, Japan, and Spain had at least a third of their publications in top 10 percentile journals. China had the highest percent publications in Q4. Finally, when the quality measures of publications (citations, citations per publication, and FWCI) were normalized to country or research metrics, the best performers were Switzerland and Denmark, while China, the USA, and Japan showed the lowest values. Conclusions While the USA and China lead in publication volume, smaller countries such as Switzerland and Denmark demonstrate superior research efficiency and impact when outputs are normalized to population, number of researchers, GDP, and research expenditure.
With the emergence of new diseases worldwide, artificial intelligence in the medical sector (Senthil, Anand, Somala, & Saravanan, 2024), and the growing focus on, among others, personalized medicine (Dalky et al., 2025), there has been a global increase in scientific research activity in the field of medicine. Publications in the field of medicine is clearly important not only for creating knowledge and developing new therapeutics for the treatment of different diseases, but also for awareness and various educational activities towards improving human health and well-being (Khatri et al., 2025). The global research output in medicine has increased by ca. 2.5 folds, from just over 414,000 publications in 2000 to over a million publications in 2024 (Scopus/SciVal, 2021). In general, the increased investment in human capital and funds, the reform in policies in support of research, and the development of research institutes lead to improved research achievements in many countries (Bambi & Pea-Assounga, 2024; Sattari, Bae, Berkes, & Weinberg, 2022; Shahid, Khin, Seong, Shahbaz, & Ahmad, 2024). It is clear, however, that the scientific contributions to medicine is not the same throughout the world since different countries have different economic competences, research focus areas, and financial support for specific fields. As the importance of research in the field of medicine increases with more profound implications on the economies in many countries, it is sensible to perform a bibliometric analysis of global publications in medicine and its various subjects. This would be useful in measuring the changes across time, monitoring the pattern of research productivity, as well as identifying potential gaps in the quantity and quality of scholarly output in the field of medicine in various countries.
There are numerous bibliometric studies on the research productivity in medicine. However, they are mostly limited to narrow timelines, areas of medicine (Chinchilla-Rodr𝚤guez, Zacca-González, Vargas-Quesada, & Moya-Anegón, 2014; Dan𝚤s & Kudu, 2022; Doja, Horsley, & Sampson, 2014; Helha & Wang, 2022; Malik et al., 2022; Manyangu, Dineen, Geoghegan, & Flaherty, 2019; Song, Jiang, Li, Ding, & Wen, 2021; Tran et al., 2019; Xia et al., 2021; Zhang et al., 2017), certain countries and regions (Boufarss, 2020; Chen, Lu, Zhang, & Ouyang, 2020; Rassi et al., 2018), or specific types of publications (Fontelo & Liu, 2018; Shi et al., 2021). Moreover, previous studies have shown that research productivity correlates strongly with economic standing and future financial and socioeconomical well-being (Jaffe et al., 2013; Laverde-Rojas & Correa, 2019). Although some publications extend to covering research productivity relative to economic status (Jaffe et al, 2020; Molina, 2020), they still provide an incomplete picture of the overall research performance in medicine. In this manuscript, using the Scopus/SciVal database, a systematic analysis of the trends of worldwide publications in the field of medicine over the last quarter of a century was performed. This study is a comprehensive assessment of the number as well as quality (citations, citations/publication, and FWCI) of publications from top research countries in medicine. In addition, the research productivity of the top 15 countries in the field of medicine were analyzed relative to their population size, GDP, number of researchers, and GERD. This study would provide the required international benchmark for decision makers and leaders to develop the necessary strategies and policies for shaping the future of research in the field of medicine within their respective countries.
Data, over 25 years, from 2000 to 2024, was extracted from Scopus/Scival (Scopus/SciVal, 2021). The “Medicine” subject area was selected from the 27 subject areas classified by Scopus. Although there could be additional publications related to medicine under other Scopus subjects, e.g. Neuroscience, Psychology, Nursing, Dentistry, etc., the data was exclusively collected from the “Medicine” subject area. All 49 subjects of “Medicine” were selected, except “Reviews and References (medical)”. This is because this subject is not well defined and it had less than ten publications per country. All data extracted was according to All Science Journal Classification (ASJC).
Measures of quantity were extracted, such as number of publications, as well as measures of quality such as count of citations, citations per publication, FWCI, and the classification of the publications, according to citescore percentile, in top percentiles journals (top 1%, 5%, 10%) and in different quartiles (Q1, Q2, Q3, and Q4). An FWCI of unity implies a citation equal to the world’s average citations in a given field of research.
In order to assess the research productivity with respect to country metrics (i.e. population and GDP), and to research metrics (i.e. number of researchers and GERD), the raw collected data was normalized to each of these metrics. GDP (current $US) and population were collected from the World Bank (WorldBank, 2021). The GERD and number of researchers were also collected from the World Bank (WorldBank, 2021), noting that these metrics are overall measures across all research fields, and not in medicine alone as this data is not available. For some countries, e.g. Switzerland, the number of researchers and GERD was not available across all years.
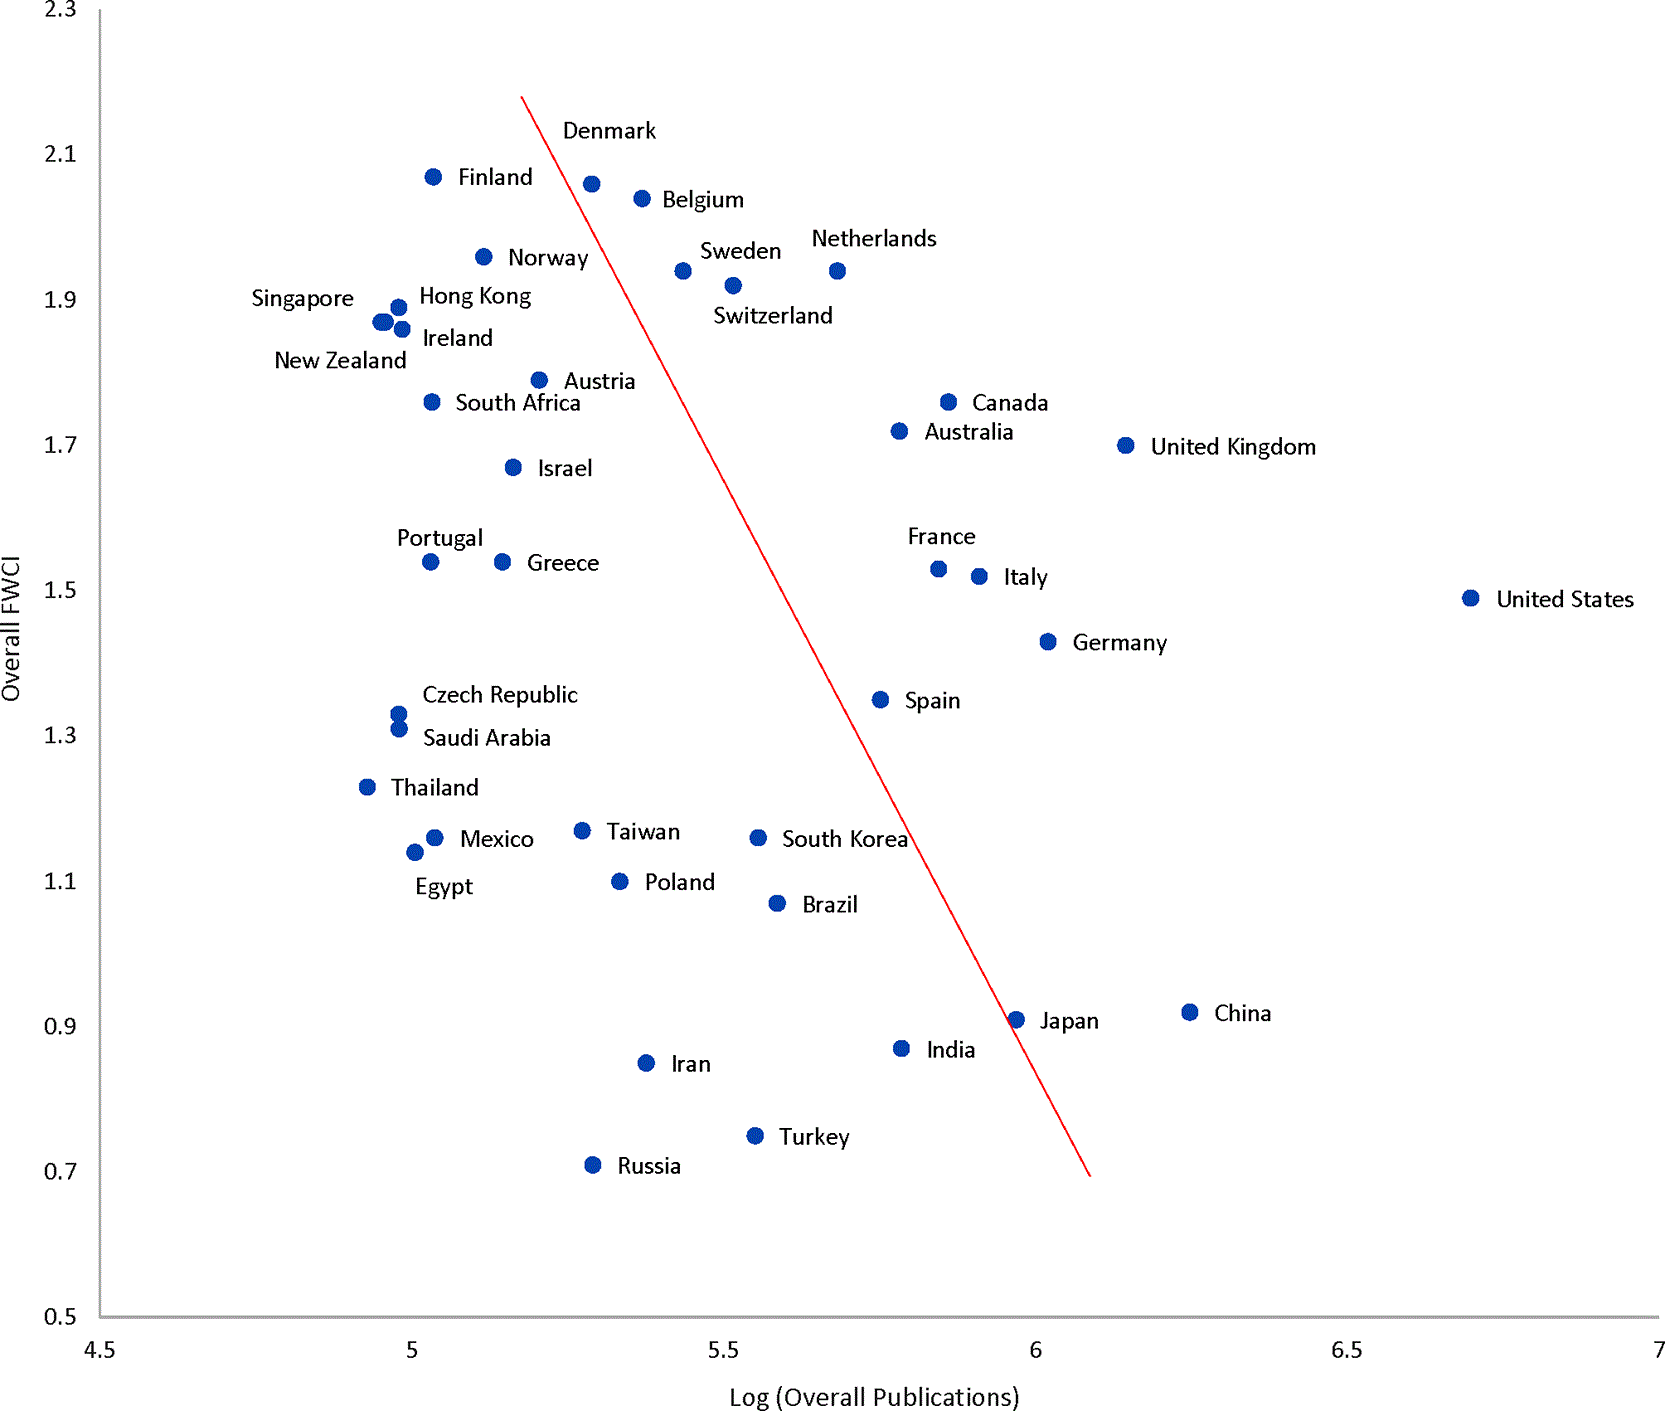
The top 40 countries were collected based on the ranking of the Scimago 2000 to 2024 in Medicine (https://scimagojr.com/countryrank.php). Then 15 countries were selected based on their high FWCI, high number of publications in medicine, or a combination of both (as depicted in Figure 2).
For measuring percent growth rates over specific periods of time, the Compound Annual Growth Rate (CAGR) was used. CAGR is given by:
CAGR%=[(fold change)1/n−1]∗100,
where n is the total number of years, and “fold change” is given by Final ValueInitial Value .
Each country’s percent share of the world’s total publications in medicine is given by:
%share of publications in medicine in the world=Publication in the coutryTotal World publications∗100.
To assess the relative levels of scholarly output in medicine, the following was analyzed over the last quarter of a century (2000–2024): the number of publications in medicine, number of publications in all fields, and the worldwide share of medicine publications as a percent of the total publications ( Figure 1). The data shows a slower growth across the years in publications in medicine (orange line) compared to those in all fields (blue line). The share of the publications in medicine with respect to all fields (grey line) decreased over the past 25 years from 31% in 2000 to 24% in 2024. This clearly indicates that, although there are worldwide efforts to increase the number of publications in medicine, as evident from the 2.6 folds increase and the CAGR of 3.9% over the last 25 years, these efforts are not sufficient to keep up with the growth noticed in publications across all fields (3.4 folds increase and a CAGR of 5.0%). It is worth noting the increased level of publications in medicine around 2019 to 2023, which is around the COVID pandemic period.
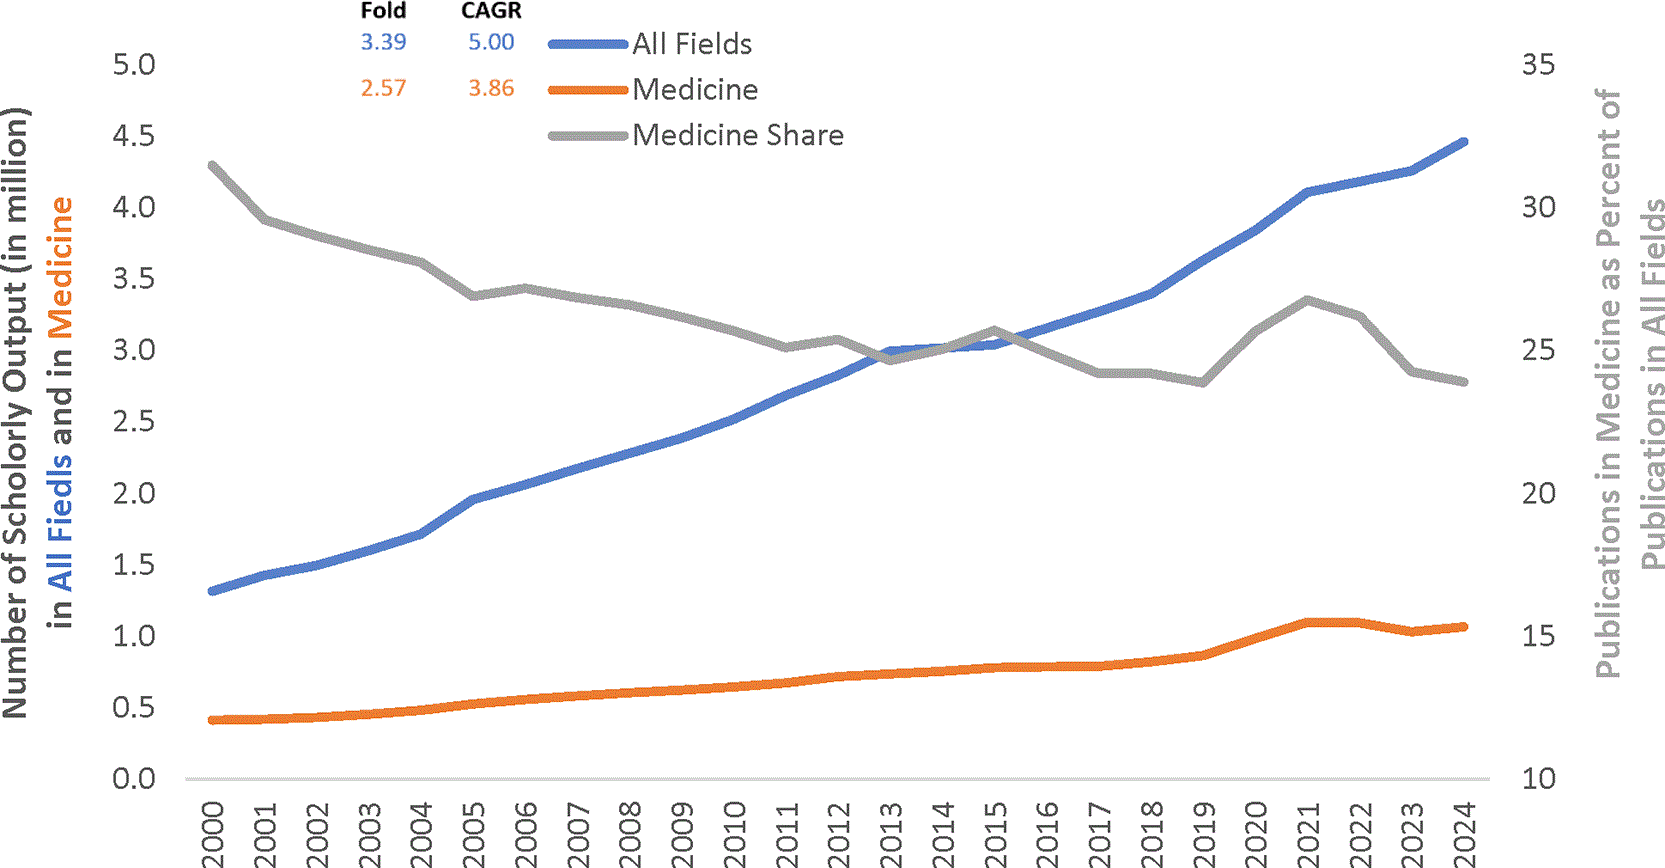
The percent publications in medicine relative to the publications in all fields is shown in grey.
The top countries in the world were selected with respect to research in medicine based on measures of quantity and/or quality, specifically their total number of publications in medicine as well as their average FWCI, between 2000 and 2024. The top-ranked 40 countries in the world in medicine research according to Scimago were considered. Figure 2 depicts the average FWCI over 25 years versus the log of the total number of publications in medicine for these selected 40 countries. The red line shown in Figure 2 further classifies the countries according to number of publications and FWCI. For further analysis, only the 15 countries that met the threshold criteria were selected. These countries have high FWCI, high number of publications in medicine, or a combination of medium to high FWCI and number of publications. The 15 selected countries are: Australia, Belgium, Canada, China, Denmark, France, Germany, Italy, Japan, Netherlands, Spain, Sweden, Switzerland, the United Kingdom (UK), and the United States of America (USA). USA and UK have the highest total number of publications in medicine for years 2000 to 2014 (214,870 and 58,558 publications, respectively). While the USA remains by far the leader in publications, China has surpassed the UK’s number of publications, in recent years, since 2014 (see Figure 3). Denmark, Belgium, Sweden, Switzerland, and Netherlands have the highest average FWCI in the past 25 years (ranging from 1.92 to 2.06).
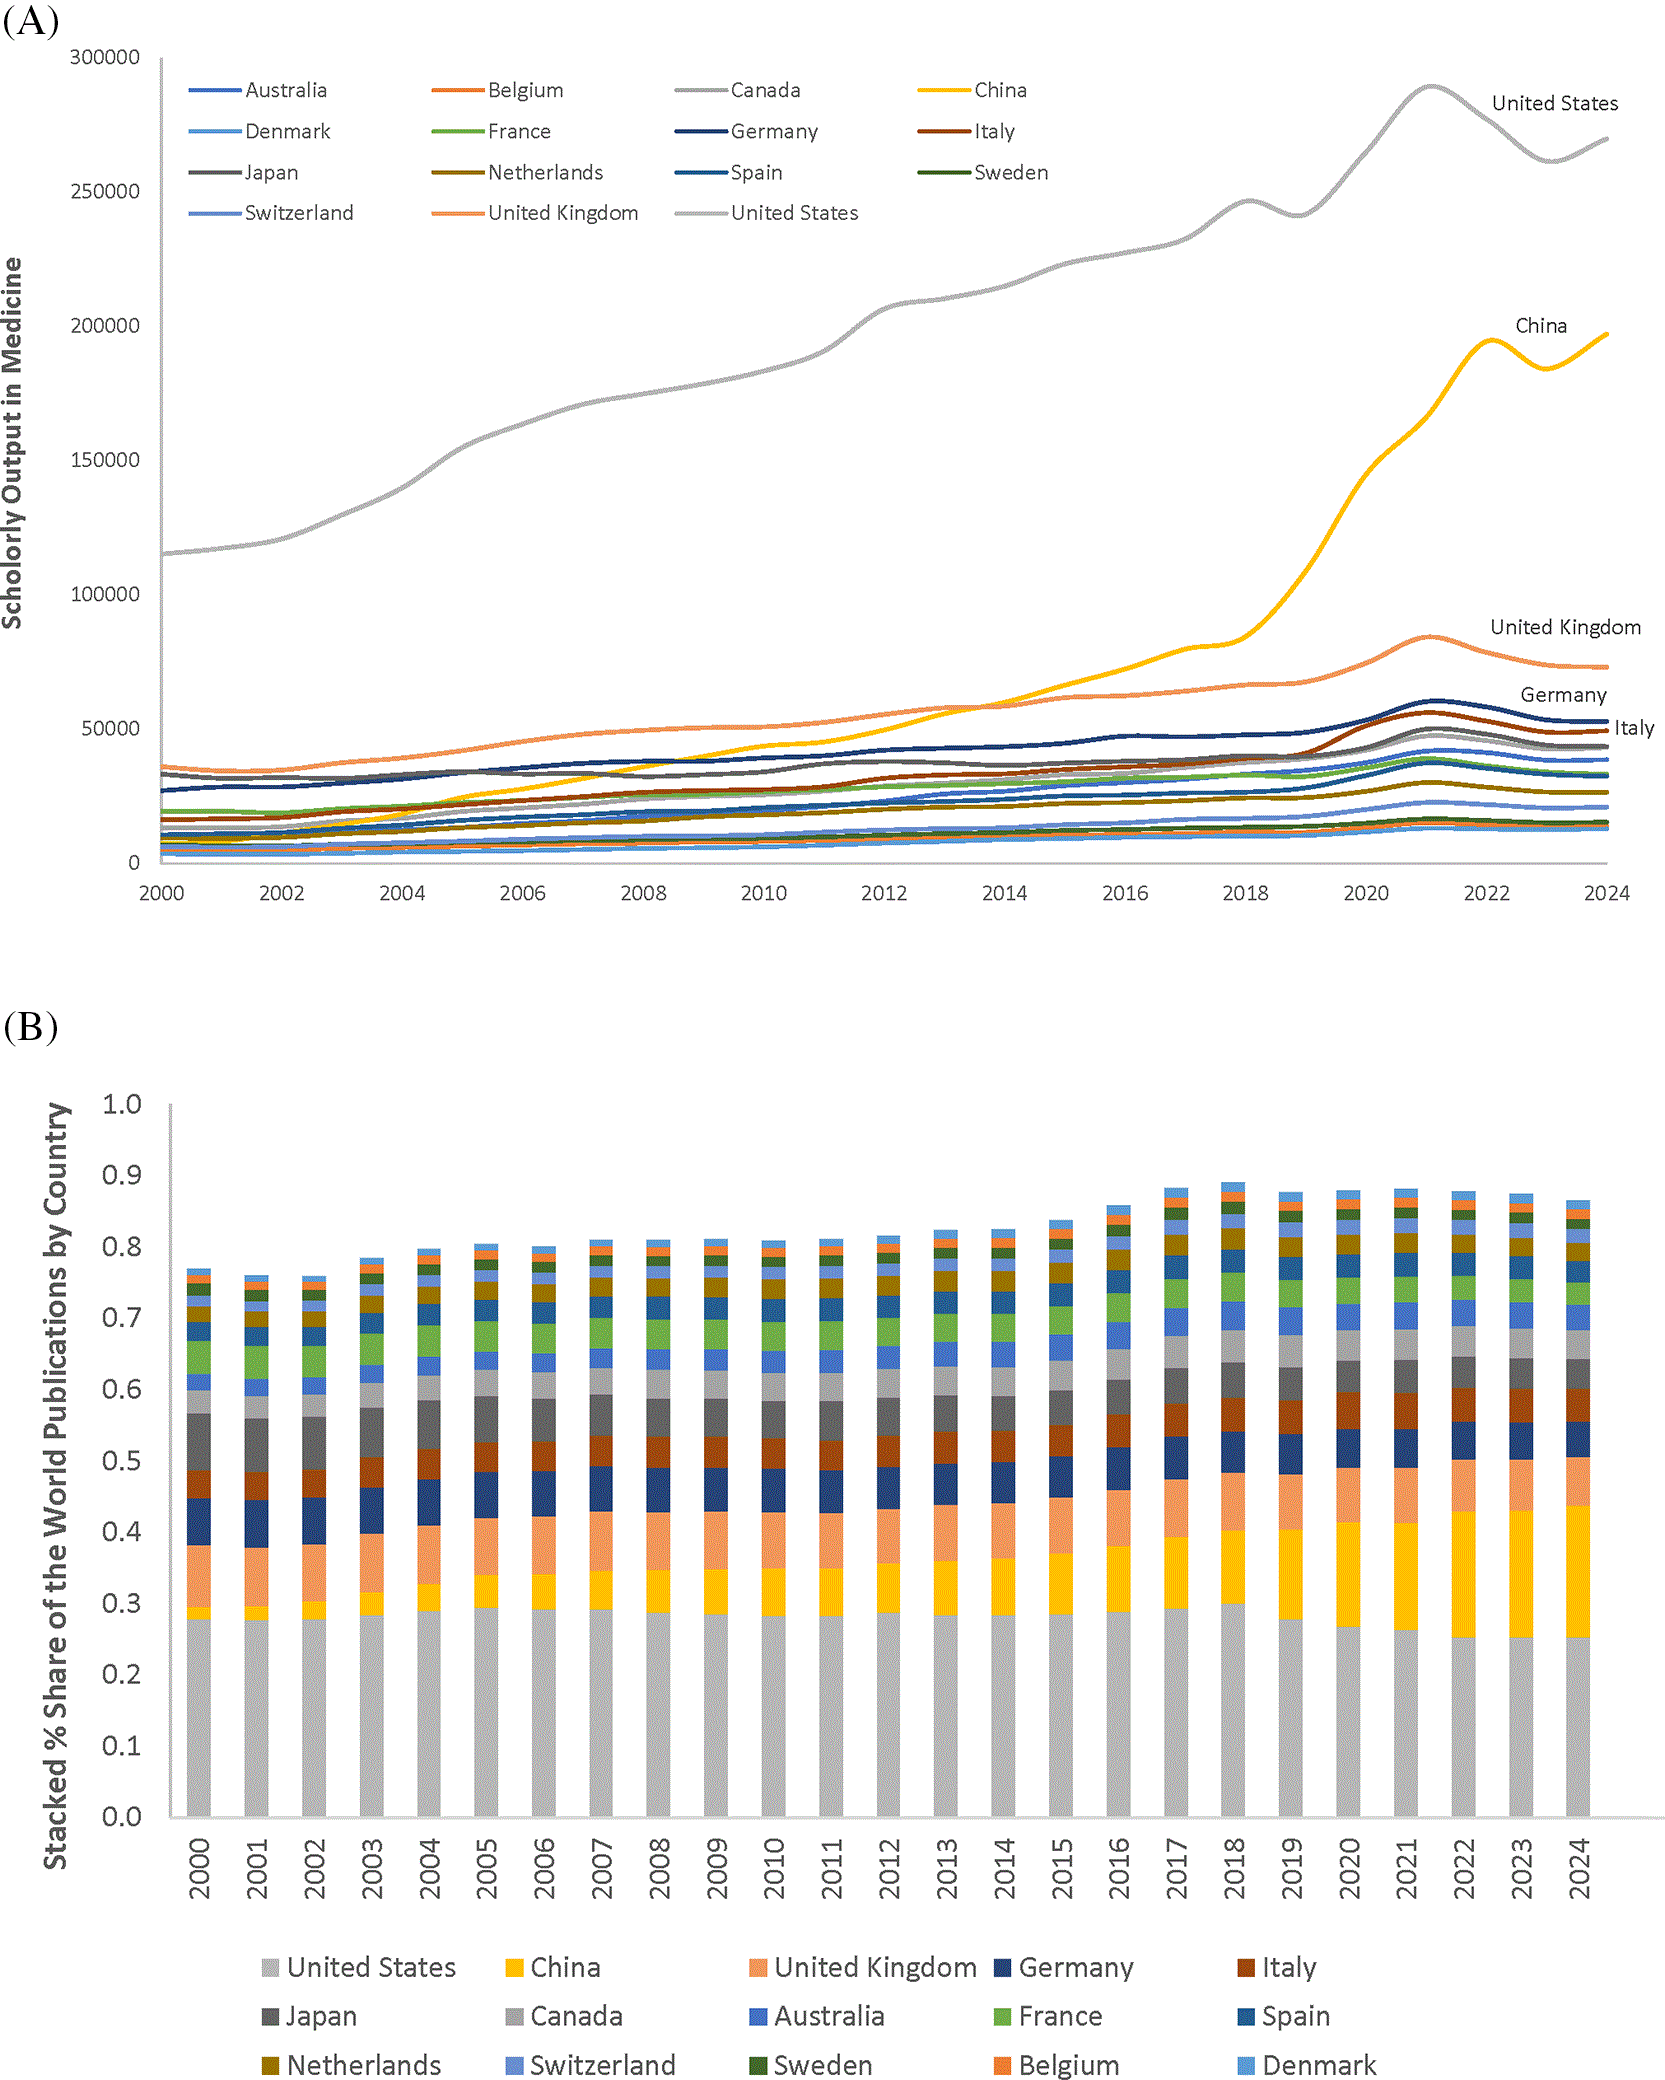
At first, the research output in medicine was compared in terms of quantity (number of publications or scholarly output) for the top 15 countries for years 2000 to 2024. Figure 3 and Table 1 highlight the number of publications and its growth in the top 15 countries. Figure 3A shows that there is a growing trend, over the years, in the medicine-related publications in these counties, albeit to various degrees (from 1.1 folds increase for Japan to 14.0 folds for China over the 25-year period). Figure 3B shows that these 15 countries contribute, each year, the majority of global publications in medicine (ranging from 76% to more than 89% of the global number of publications in medicine).
This table corresponds to Figure 3A.
Tables 2A, 2B, and 2C correspond to Figures 5A, 5B, and 5C, respectively.
The USA leads the world in the number of publications in medicine across the years, followed by China (especially in the recent years), the UK, Germany, and Italy. Although China’s total publications (197,086 in 2024) is by far lower than the USA’s (269,752 in 2024) ( Figure 3A), China’s GAGR of 14.0% (from 2000 to 2024) and its 26.5-fold increase in publications during the same period is far higher than the growth measures for any other country across the past 25 years ( Table 1). China’s growth is also noticeable even when considering the last 5 years, followed by Denmark ( Table 1). This growth (i.e. in China) is likely due to increased investment in scholarly activities in various fields including medicine and perhaps the development of national strategies towards research in medicine. The USA has consistently maintained the highest number of publications and the highest share across the years, although its share of publications worldwide has slightly decreased from 27.8% in 2000 to 25.3% in 2024 ( Figure 3B). In contrast, China’s share has increased significantly from 1.8% in 2000 to 18.5% in 2024. All countries had roughly equal contributions over the years, with the exception of China’s increase by an order of magnitude and Japan’s decrease by ~50% in the earlier years, Australia’s contribution almost doubled over the years, and France’s slight decline in recent years ( Figure 3B). The total share of publications by the 15 selected countries has recently been ca. 90% of the world publications in medicine. In summary, the USA is leading the way with respect to the number of publications and its share of publications worldwide, while China is leading the way in terms of the growth in the number of scholarly output in medicine across the years. It is, therefore, clear that research productivity in a country is directly linked to its economic potential. In other words, higher income countries such as USA and China generally have a higher research output ( Figure 3A) since they potentially invest more on research and development.
To examine research productivity across the 49 different subjects of “Medicine”, the cumulative number of articles published in each subject between 2000 and 2024 was determined for the 15 selected countries combined ( Figure 4A). A caveat to these 49 subjects of “Medicine” is that the analysis does not capture the publications related to medicine that are under other Scopus subject areas, e.g. Biochemistry, Genetics and Molecular Biology; Neuroscience; Psychology; Nursing; Dentistry; etc., since the collected data was exclusively from the 49 subjects under the “Medicine” subject area. Therefore, it is likely that the number of publications related to medicine is far beyond the numbers shown in Figure 4 and there are other medicine related disciplines that are not captured here in the list of 49 subjects.
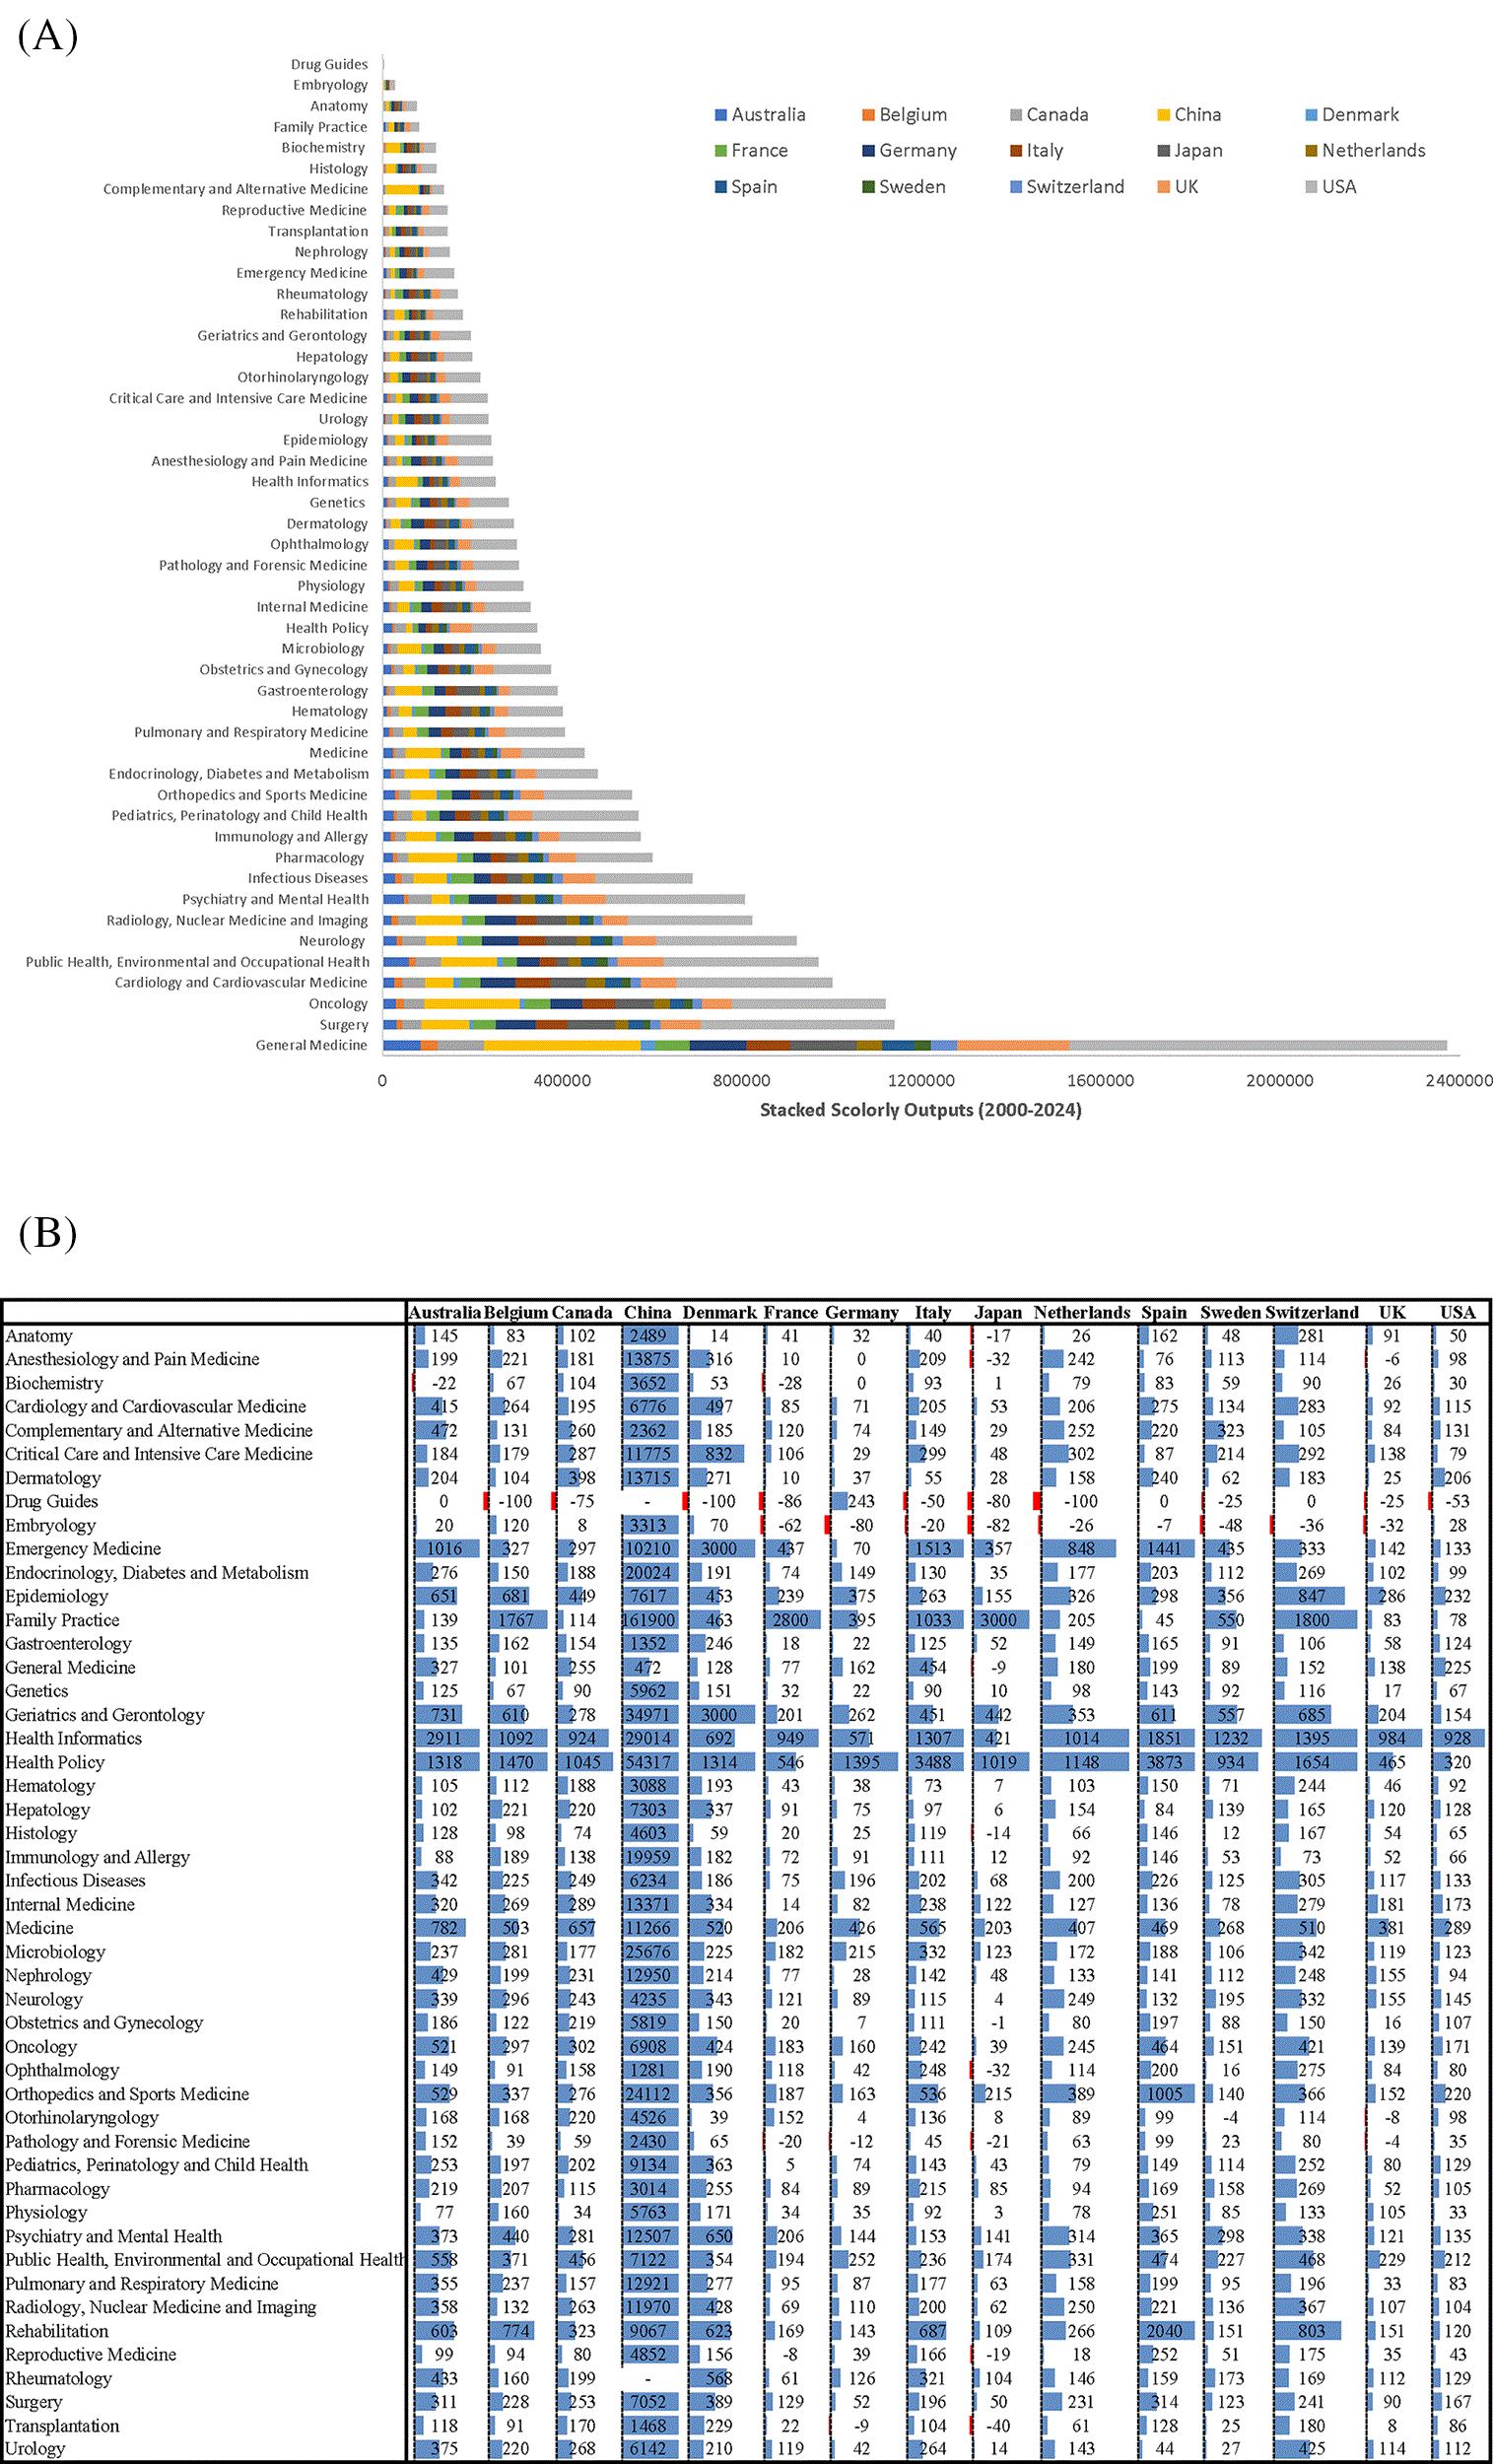
A) The number of articles, stacked by country for the 15 selected countries, published in the 49 ASJC subjects in “Medicine”. B) Percent growth in the number of articles published in the 49 ASJC subjects in “Medicine” in the 15 selected countries. For a better visualization of the results, data bar lengths are capped at a maximum scale of 1000 (values >1000 appear at full length). A hyphen denotes cases where percent growth is undefined due to a zero value.
The data shows that the USA is the leader in publishing in all subjects, followed by China, and then the UK. The highest cumulative number of publications for the 15 selected countries corresponds to the subject of “General Medicine”, followed by “Surgery”, and “Oncology”. All publication shares and ranks for the 15 selected countries are consistent across subjects, i.e. the top publishing country in one subject remains the top publishing country in other subjects as well. It has been shown that high-income countries (which happen to include the top 15 selected ones in this study) not only lead in Medicine and Health research, but also invest heavily in fields such as Psychology and the Arts (Jaffe et al., 2020). This could be related to the fact that “Psychiatry and Mental Health” ranks among the top 10 research topics (see Figure 4A). On the other hand, lower-income countries focused mainly on Veterinary, Immunology/Microbiology, and Agriculture (Jaffe et al., 2020). This is likely due to the different concerns in higher-income vs. lower-income countries, where the former are more concerned about mental health and leisure and the latter are more concerned about food security and survival. Therefore, the focus of countries on specific research disciplines, as well as their overall investments in research funding and in human capital, may play an important role in shaping their future economic status.
As shown in Figure 4B, China has the highest percent growth in most of the subjects, with an exceptional growth of 161,900% growth in “Family Practice”, and 54,317% growth in “Health Policy”. “Health informatics” and “Health Policy” witnessed more substantial growth rates compared to other subjects in most of the 15 selected countries. In fact, there is a clear growth in all countries in all subjects, except the “Drug Guides” and “Embryology” subjects, in addition to other few instances highlighted in red in Figure 4B.
In summary, the USA is the best performer in publications in all subjects of medicine and China has the largest percent growth in most of the subjects. The subject of “General Medicine” had the highest cumulative number of publications for the top 15 countries.
The research output of the 15 selected countries was then normalized to their population ( Figure 5A), GDP ( Figure 5B), and GDP/capita ( Figure 5C). When normalized to population, the scholarly output is the highest in Switzerland, Denmark, Netherlands, and Australia ( Figure 5A), which is consistent with previous findings (Rassi et al., 2018). Despite the highest CAGR and fold growth in China, in the last 25 years (13.5% and 23.8 folds, respectively) and even in the last 5 years (6.4% and 1.4 folds, respectively) (Table 2A), China has the lowest numbers of publications per capita, across the years, compared to the 15 selected countries. For example, in 2024, China has 140 publications per million capita, which is only 6% of the reported value for Switzerland (2,326 publications per million capita). This is because of the high total population in China.
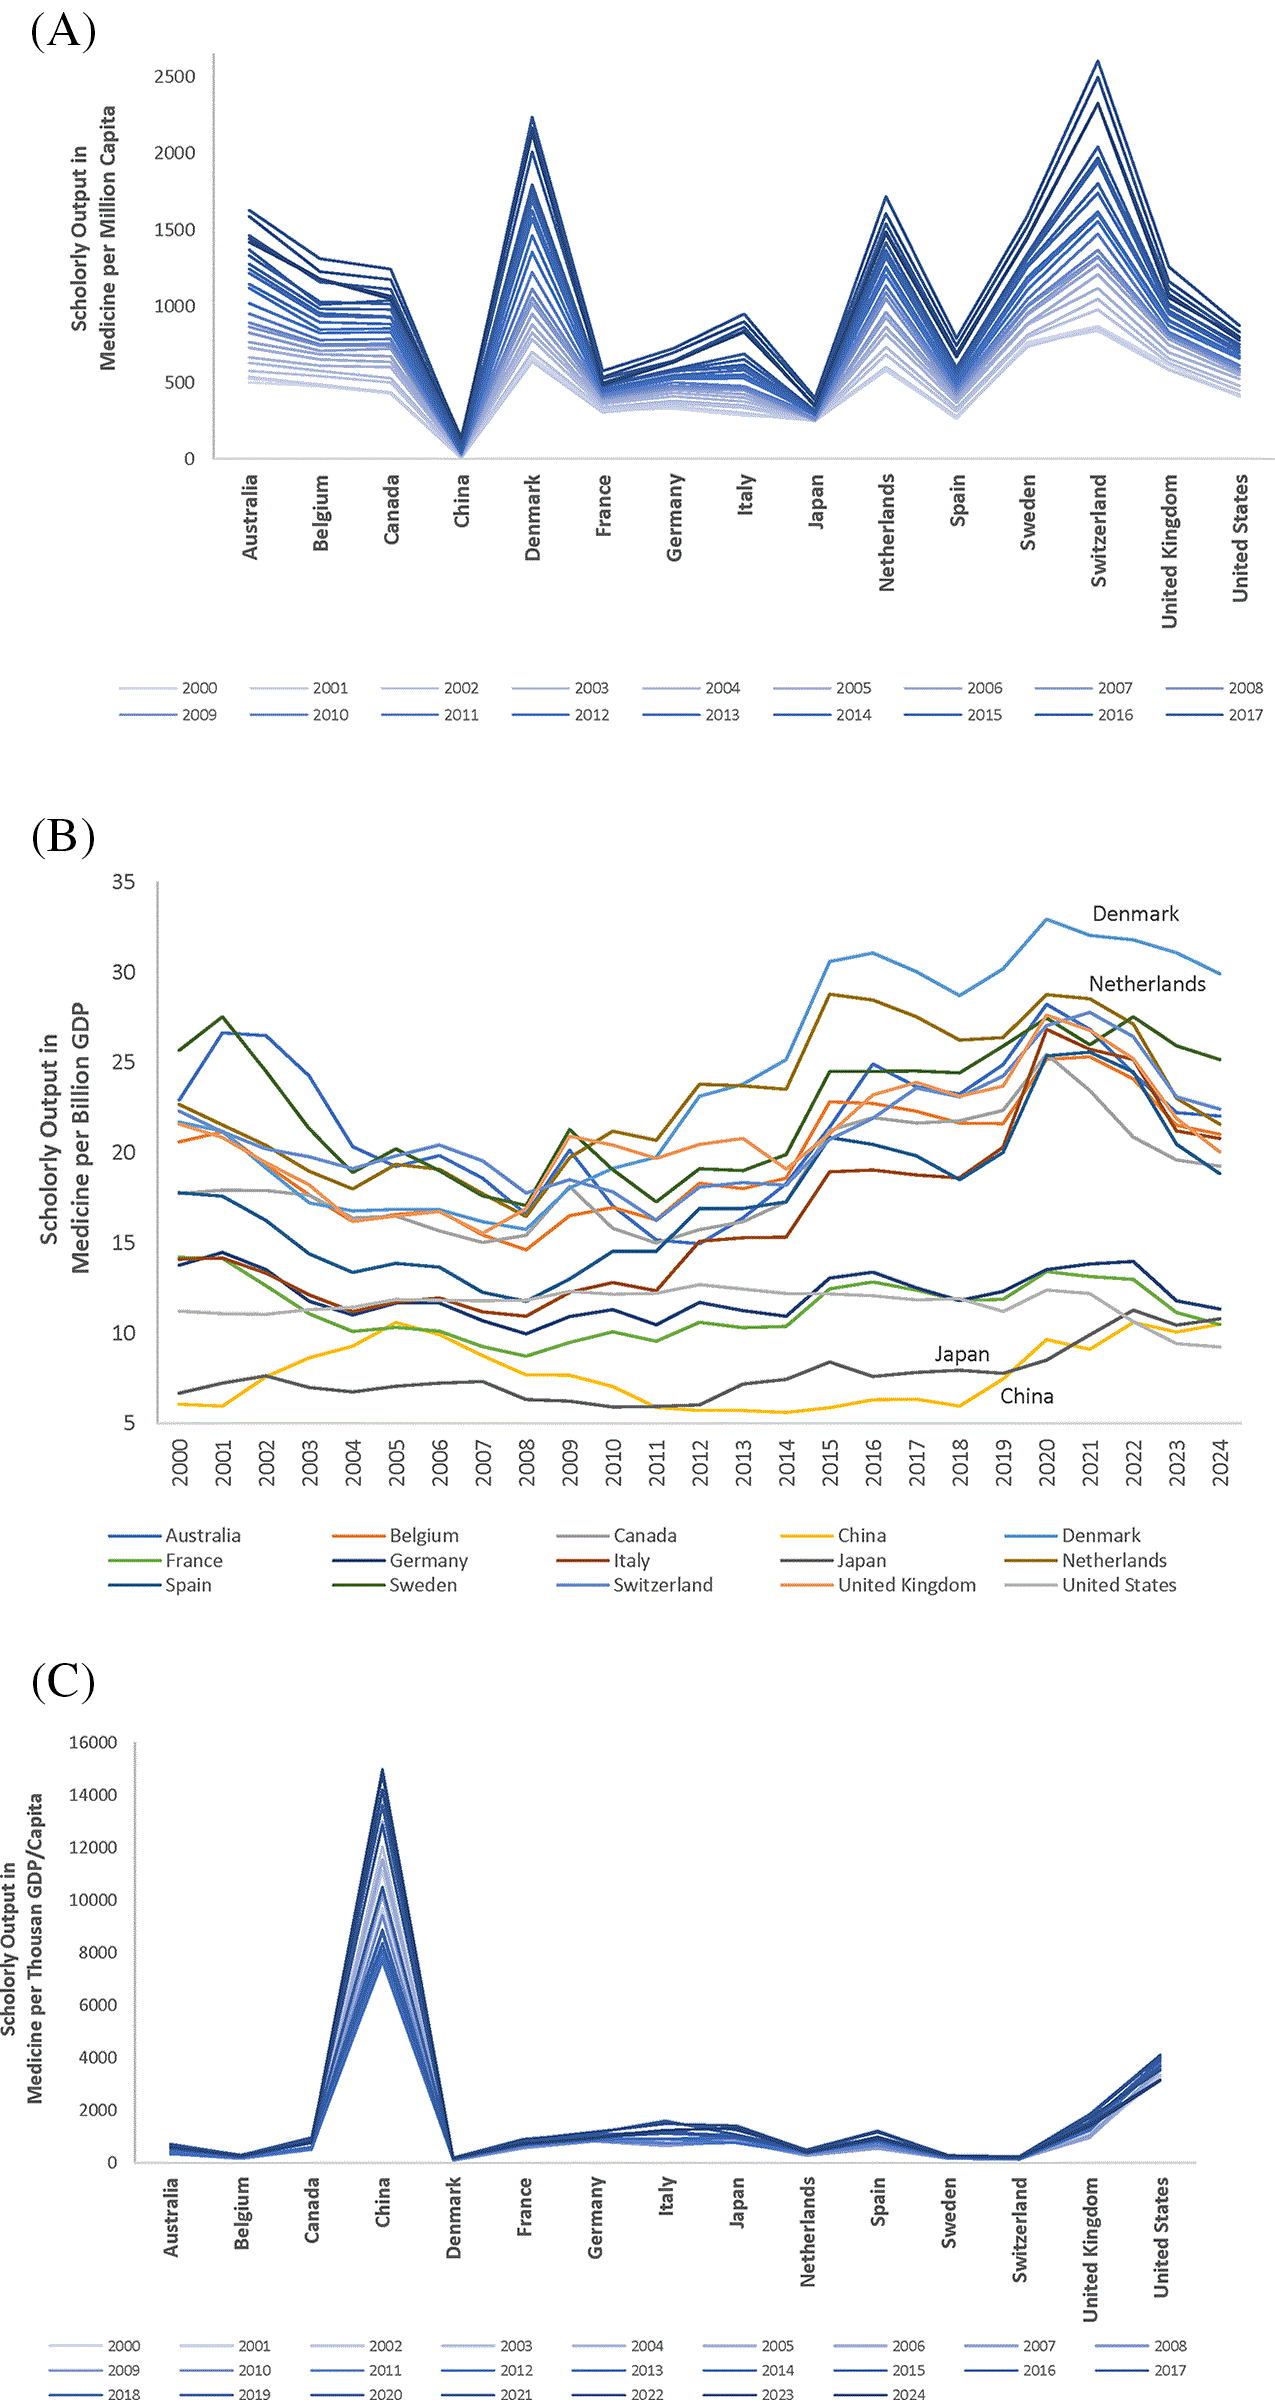
When the number of publications was normalized with respect to GDP, the values fluctuated across the years with a noticeable dip between 2004 and 2014 for most countries. Given that the number of publications was consistently increasing throughout these years (see Figure 3A), the dip in publications per GDP reflects the boost in GDP for this period (data not shown). However, during the last decade, there was a clear increase in performance for most of the countries ( Figure 5B). In particular, in 2024, Denmark and Netherlands stood out as best performers with 30 and 22 publications per billion GDP, respectively. Although in 2024 the USA had the lowest value of 9.2 publications per billion GDP, and France had 10.5 publications per billion GDP, over the years, China and Japan had the lowest records (see Figure 5B) with a relatively stagnant CAGR across the years (2.2% and 1.9%, respectively) ( Figure 5B and Table 2B). For China, its low number of publications per GPD could be attributed to its relatively high GDP (second to the USA’s GDP) compared to the other countries. Japan had the highest CAGR in the past 5 years (4.9%).
As shown in Figure 5C, China has outperformed, by far, any other country in the count of publications per GDP/capita. This is because of the large number of publications and the small ratio of GDP/capita given the very high population in China. Japan and China had the highest CAGR in the last 5 years, 4.5% and 1.7%, respectively (Table 2C). China demonstrated the highest publication output relative to GDP/capita, followed by the USA and the UK.
In summary, when the number of publications was normalized to population, the scholarly output was the highest in Switzerland, Denmark, Netherlands, and Australia, but again China had the highest CAGR over the last 25 or 5 years. With respect to GDP, Denmark and Netherlands were the best performers while Japan and China had the lowest values. With respect to GDP/capita, China was the best performer amongst all the 15 selected countries.
The research output of the 15 selected countries was normalized to the number of researchers ( Figure 6A), GERD ( Figure 6B), and GERD/researcher ( Figure 6C). A caveat of these normalizations to research metrics is that the number of researchers is the total researchers in all fields rather than those in medicine alone. Similarly, the GERD is the total expenditure on R&D in research across all fields, and not exclusively for research in medicine. While the data for the number of researchers and GERD were sporadically incomplete for some of the countries (mostly for Switzerland), it was still possible to obtain a general picture of these countries’ publications in medicine relative to their research metrics. Figure 6A shows that Switzerland, Netherlands, and Italy had, across the years, high overall publications per thousand researchers with the highest records being 432 in 2021 for Switzerland, 372 in 2009 for Netherlands, and 257 in 2021 for Italy. On the other hand, China and Japan had the lowest records with the maximum values being 71 in 2021 for Japan, and 74 in 2022 for China ( Figure 6A). This illustrates that China and Japan had a high number of researchers relative to their publication numbers. In fact, the USA and China have comparable numbers of researchers, however, because of the USA’s substantially higher number of publications relative to China’s ( Figure 3A), the USA outperformed China (and Japan) in the number of scholarly output per researcher.
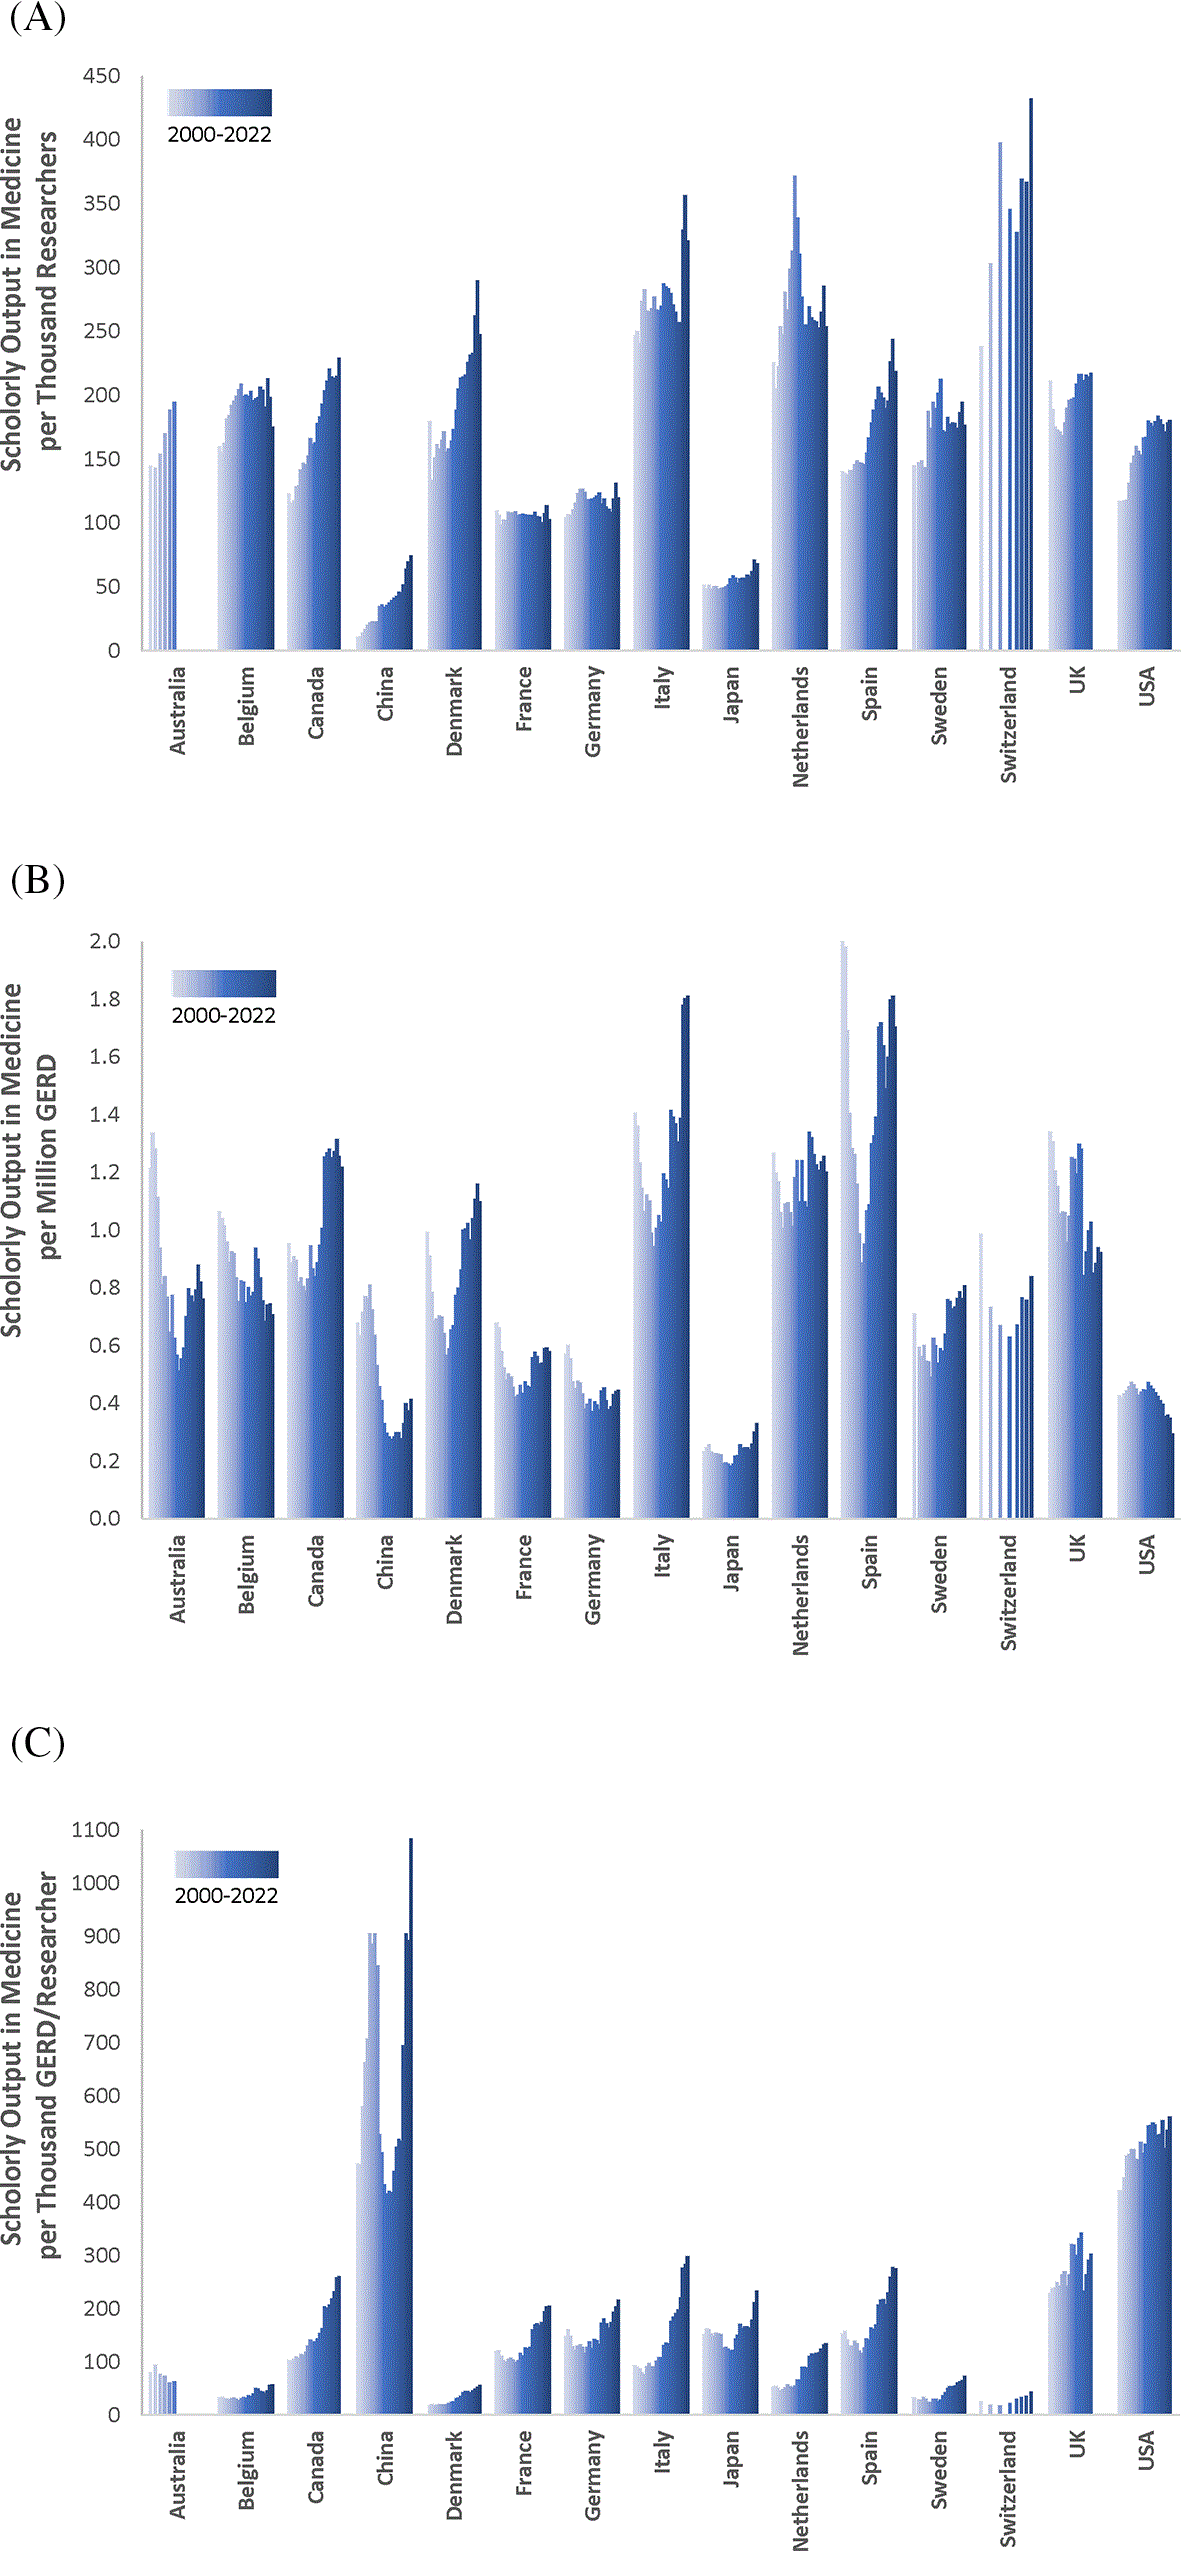
When normalized to GERD, in the recent years, China, Japan, and the USA had the weakest performance. The rest of the countries, especially Spain and Italy, performed better with the highest values reaching 2 publications per million GERD ( Figure 6B). With respect to the normalization of the scholarly output in medicine to GERD/researcher, China and the USA had the highest values ( Figure 6C).
Overall, it would be more informative to do these analyses with the number of researchers and GERD specifically in medicine (rather than values across all research fields). However, these data are either not publicly available, not consistently reported across countries and years, or lack sufficient reliability.
Publications in different journal percentiles (1%, 5%, 10%, Q1, Q2, Q3, and Q4), citations, citations per publication, and FWCI were then used as measures of research quality. Figure 7A depicts the quality of the publications in each of the 15 selected countries across the past quarter of a century. The publications are ranked cumulatively in top 1%, 5%, 10%, 25% (Q1), 50% (Q2), 75% (Q3), and 100% (Q4). The data clearly shows that China has the worst quality of publications with barely any publications in top 1% journals across the years and up to 65% of the publications in Q4 in the earlier years. However, over the last couple of decades, China has shown the best improvement in the quality of publications (with a very steep decrease in publications in Q4 journals, and a substantial increase in the better quality journals), while many of the best performing countries have had either stagnant levels of publications in top journals as in Australia, France, and Germany, or even declining levels as in Italy, Japan, and the USA. Netherlands has a higher percentage of publications in higher ranked journals. Overall, apart from China and Japan (and, to a lesser extent, Spain, Germany, and Italy, which show rates between 20% and 28%), the proportion of publications appearing in top 10% journals is generally between 30% and 40% across countries.
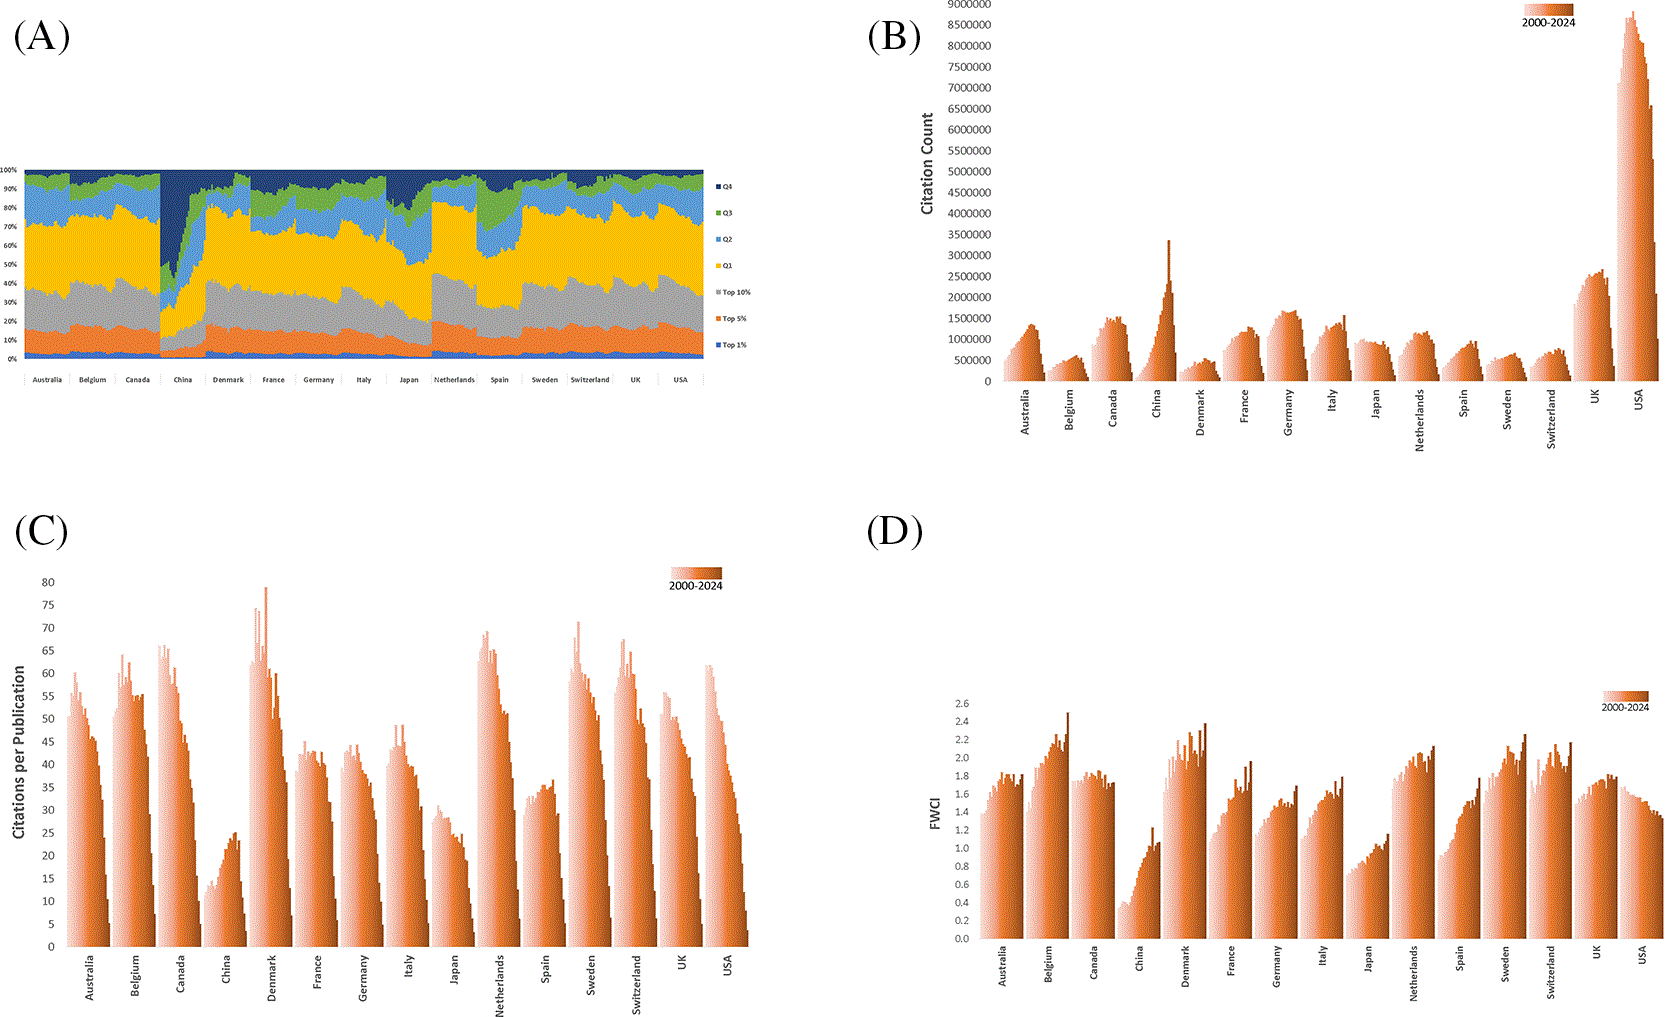
Other measures of quality were also considered, e.g. total citations ( Figure 7B), citations per publication ( Figure 7C), and FWCI ( Figure 7D). With respect to citations, the USA has the highest citation count, by far, compared to other countries ( Figure 7B). Assuming that the number of citations scales with the number of publications, this is not an unexpected result as the UAS has, by far, the highest number of publications ( Figure 3A). In fact, the USA has ca. 3.3 times more citation counts than the second-best country in citations, the UK. China has a very low number of citation count considering it is the second highest, after the USA, in the number of publications ( Figure 3A). This is likely because of the lower quality of publications in China ( Figure 7A). Further, the citation count is expected to lag the publications by a few years. This contributes to the decreased levels of citations in recent years observed for all countries (thus the dome shapes in Figure 7B). The dome shape is more triangular for China, which can be linked to the fact that China had a tremendous increase in the number of publications in the last 7 years ( Figure 3A, and a CAGR of 6.4% in the past 5 years, as shown in Table 1) and an increase in the quality of publications in the past couple of decade ( Figure 7A).
Compared to the number of citations, citations/publication is a better way to measure quality of publications. With respect to citations per publication, China clearly has the lowest numbers across the years with up to 25 citations/publication, followed by Japan and Spain (up to 31 citations/publication), and then France, Germany, and Italy at ca. 44 citations/publication. The rest of the countries have ca. 55–80 citations/publication ( Figure 7C).
The performance of countries in the quality of publications in medicine was also compared using another measure, FWCI, which standardizes citation frequencies to each field of research. There is an observed increase in FWCI for most of the countries, except for Canada (flat) and the USA (decreasing). The steepest growth in FWCI observed were in China and Spain ( Figure 7D). All of the 15 selected countries (except China and Japan, in the earlier years) have an FWCI greater than the world average FWCI of 1.0 ( Figure 7D).
In summary, when evaluating quality measures of publications in medicine, countries like USA, but also Denmark, Netherlands, Sweden, and Switzerland stood out. On the other hand, China did not perform well in any of these quality measures, although it showed the steepest improvement in almost all of them.
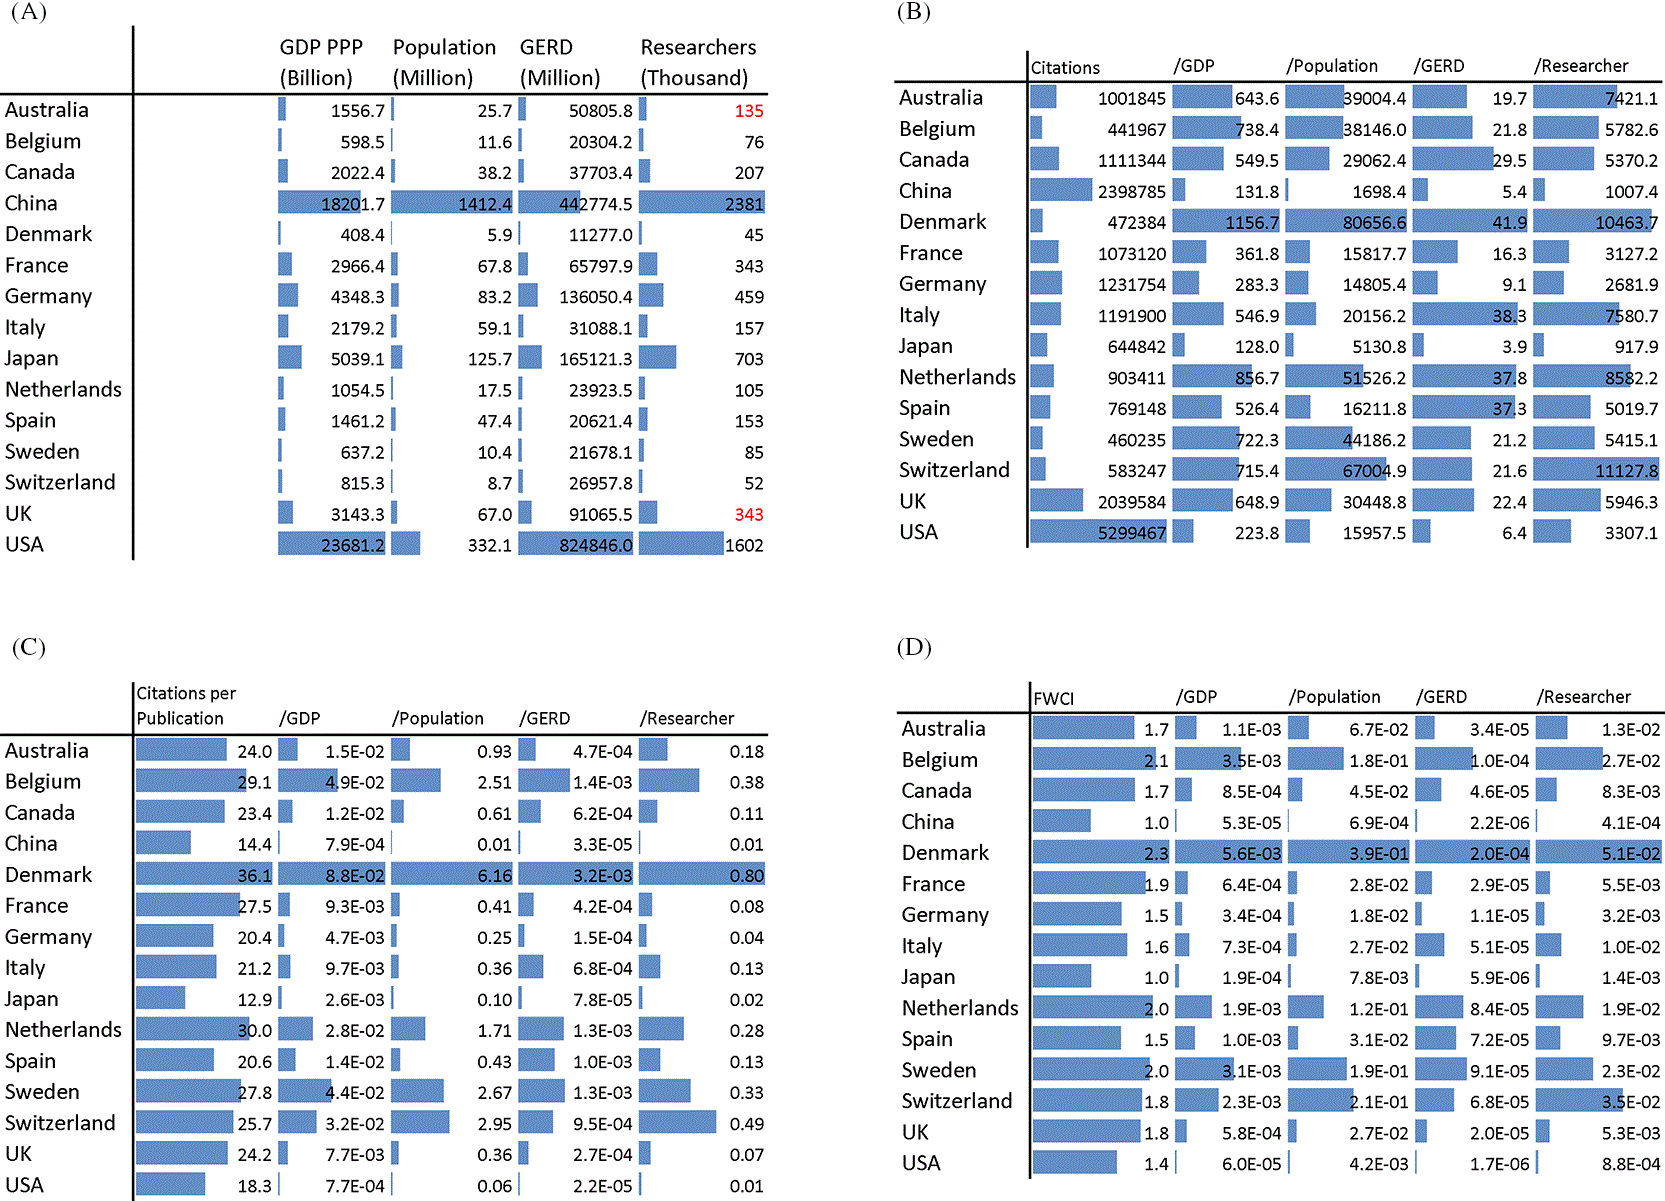
Figure 8 shows that the quality measures (citations, citations per publication, and FWCI) normalized with respect to country (GDP and population) and research (GERD and the number of researchers) metrics. Figure 8A shows these metrics for the 15 selected countries for the year 2021. China has the highest population and, along with the USA, have high GDP, GERD, and number of researchers. Japan also has a relatively high GERD and number of researchers. With respect to citations, Switzerland, Netherlands, and Denmark are the best performers when normalized to the any of the four metrics. On the other hand, China, followed by Japan and the USA have the lowest normalized citations ( Figure 8B), noting that the USA has one order of magnitude more citations ( Figure 7B) than any of the top performing countries. When citations per publication are normalized to country and research metrics, Denmark and Switzerland stood out. China, again, and the USA (followed by Japan) had the lowest values ( Figure 8C). The same trends observed in Figure 8C are noticed when FWCI is normalized to the same research and country metrics ( Figure 8D).
In this paper, the research performance is assessed across the globe in the field of medicine. First, 40 countries, among all countries worldwide, were filtered according to the Scimago ranking, of which only 15 countries were selected, based on their number of publications and/or FWCI, for further bibliometric analysis. The total contributions in publications in medicine from these 15 countries ranged from 76% to 89% of the total world publications over the last 25 years. The data shows that, while the worldwide number of publications in medicine has been increasing over the last 25 years, its share of total publications across all fields has been decreasing. The top performing countries with respect to the number of publications, across the years, are the USA by far, followed by China and the UK. China had the highest growth (26.5-fold increase) in publications over the last 25 years, which is one order of magnitude more than the growth witnessed in any of the other 14 countries. In terms of the subjects within the “Medicine” area, the most published subjects in many countries are “General Medicine” followed by “Surgery” and “Oncology”. With respect to the quality of publications, all countries, expect China, Japan, and Spain had at least a third of their publications in the top 10 percentile journals. Although China had, in the earlier years, over half of its publications in Q4, it had exceptionally improved over the last decade (Q4 publications reduced to ca. 15% and publications in top percentile journals increased). Moreover, China and Japan, followed by Spain, had lower citations per publication and FWCI compared to the other countries, although China had the steepest growth in FWCI.
When the number of scholarly output was normalized to GDP, Denmark and Netherlands performed the best. They were also ranked best, along with Switzerland, when the number of publications were normalized to population. Again, China and Japan had the lowest values when the research output was normalized to population and GDP. Despite its high numbers of publications and quality measures (especially total citations), the USA did not perform well when the data was normalized to either GDP or population. When the scholarly output was normalized to number of researchers, Switzerland, Netherlands, and Italy had the highest values, while China and Japan again had the lowest values. When normalized to GERD, China, Japan, and the USA performed poorly, especially in recent years. When quality measures (citations, citations per publication, and FWCI) were normalized to country or research metrics, Switzerland and Denmark were the best performers, while China, the USA, and Japan showed the lowest values.