Просмотр новости
Найдите то, что Вас интересует
 Спутники
 РН
РН SpaceX
 Роскосмос
 NASA
NASA
СпутникиРНSpaceXРоскосмосNASAU.S. fertility rates have hit historic lows, but three common measures tell different stories about whether American families are truly shrinking.
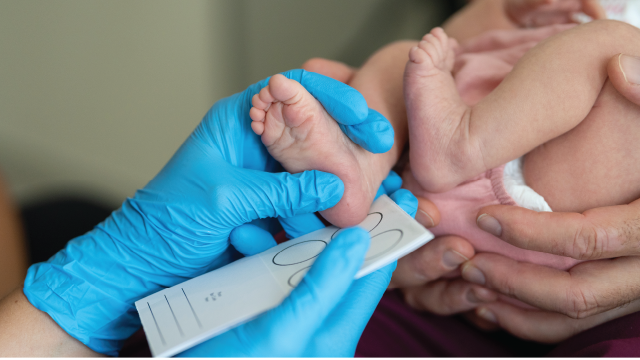 (Abraham Gonzales Fernandez via Getty Images)
Over the past year, many news outlets have reported that the birth rate in the United States has hit an all-time low. This trend has led some experts to worry about the economic consequences of a shrinking population. And the federal government has recently been considering incentives to increase the birth rate.
The country’s total fertility rate – the number of children an average woman is expected to have in her lifetime – has trended mostly downward since the Great Recession of 2007 to 2009. It reached a historic low of 1.60 in 2024.
U.S. fertility hit an all-time low in 2024, according to 2 of 3 fertility measures
Note: Lowest values in each series are labelled. Where necessary, values for children ever born are interpolated.
Source: National Center for Health Statistics and Pew Research Center analysis of 1976-2024 Current Population Surveys, June Fertility Supplement (IPUMS).
PEW RESEARCH CENTER
U.S. fertility hit an all-time low in 2024, according to 2 of 3 fertility measures
| Year | General fertility rate | Total fertility rate | Children ever born |
|---|---|---|---|
| 1974 | 67.8 | 1.84 | |
| 1975 | 66.0 | 1.77 | |
| 1976 | 65.0 | 1.74 | 3.09 |
| 1977 | 66.8 | 1.79 | 3.14 |
| 1978 | 65.5 | 1.76 | |
| 1979 | 67.2 | 1.81 | 3.00 |
| 1980 | 68.4 | 1.84 | 2.99 |
| 1981 | 67.3 | 1.81 | 2.86 |
| 1982 | 67.3 | 1.83 | 2.78 |
| 1983 | 65.7 | 1.80 | 2.69 |
| 1984 | 65.5 | 1.81 | 2.56 |
| 1985 | 66.3 | 1.84 | |
| 1986 | 65.4 | 1.84 | 2.30 |
| 1987 | 65.8 | 1.87 | 2.22 |
| 1988 | 67.3 | 1.93 | 2.15 |
| 1989 | 69.2 | 2.01 | |
| 1990 | 70.9 | 2.08 | 2.05 |
| 1991 | 69.3 | 2.06 | |
| 1992 | 68.4 | 2.05 | 2.02 |
| 1993 | 67.0 | 2.02 | |
| 1994 | 65.9 | 2.00 | 1.96 |
| 1995 | 64.6 | 1.98 | 1.96 |
| 1996 | 64.1 | 1.98 | |
| 1997 | 63.6 | 1.97 | |
| 1998 | 64.3 | 2.00 | 1.88 |
| 1999 | 64.4 | 2.01 | |
| 2000 | 65.9 | 2.06 | 1.91 |
| 2001 | 65.1 | 2.03 | |
| 2002 | 65.0 | 2.02 | 1.93 |
| 2003 | 66.1 | 2.05 | |
| 2004 | 66.4 | 2.05 | 1.90 |
| 2005 | 66.7 | 2.06 | |
| 2006 | 68.6 | 2.11 | 1.86 |
| 2007 | 69.3 | 2.12 | |
| 2008 | 68.1 | 2.07 | 1.90 |
| 2009 | 66.2 | 2.00 | |
| 2010 | 64.1 | 1.93 | 1.91 |
| 2011 | 63.2 | 1.89 | |
| 2012 | 63.0 | 1.88 | 2.00 |
| 2013 | 62.5 | 1.86 | |
| 2014 | 62.9 | 1.86 | 2.02 |
| 2015 | 62.5 | 1.84 | |
| 2016 | 62.0 | 1.82 | 2.07 |
| 2017 | 60.3 | 1.77 | |
| 2018 | 59.1 | 1.73 | 2.01 |
| 2019 | 58.3 | 1.71 | |
| 2020 | 55.7 | 1.64 | 1.96 |
| 2021 | 56.3 | 1.66 | |
| 2022 | 56.0 | 1.66 | 1.91 |
| 2023 | 54.5 | 1.62 | |
| 2024 | 53.8 | 1.60 | 1.92 |
Note: Lowest values in each series are labelled. Where necessary, values for children ever born are interpolated.
Source: National Center for Health Statistics and Pew Research Center analysis of 1976-2024 Current Population Surveys, June Fertility Supplement (IPUMS).
PEW RESEARCH CENTER
But there are two other commonly used measures of fertility, and each tells a slightly different story.
About this researchThis Pew Research Center analysis summarizes recent U.S. fertility trends and explains why these measures sometimes differ.
Why did we do this?Pew Research Center does high-quality research to inform the public, journalists and leaders. This analysis builds on a larger body of work that explores how the American family is changing.
Learn more about Pew Research Center and our research on birth rates and fertility.
How did we do this?Trends in the general fertility rate and the total fertility rate are published by the National Center for Health Statistics. The information used to calculate these measures come from U.S. birth certificates.
The trend in the number of children ever born comes from an analysis of the Current Population Survey’s June Fertility Supplement. This information is self-reported. The microdata files we used for this analysis were provided by IPUMS from the University of Minnesota. IPUMS standardizes variable names and coding across years as much as possible, making it easier to analyze data over time.
What are the various ways to measure fertility rates?The general fertility rate (GFR) is the number of births per 1,000 women ages 15 to 44. By this measure, national fertility hit its lowest point on record in 2024, when there were fewer than 54 babies born for every 1,000 U.S. women in their childbearing years. The GFR has fallen almost every year since the Great Recession, and preliminary data suggests it dipped even further in 2025.
The GFR is shaped by the age distribution of women in their childbearing years: ages 15 to 44. Nowadays, women most often have children in their late 20s and early 30s. If most U.S. women ages 15 to 44 were in their teens and 40s, then the GFR would be lower because fewer women overall would be in the most common childbearing ages.
The total fertility rate (TFR) is an estimate of the number of children an average woman is expected to have in her lifetime, using present trends. Unlike the other common fertility measures, the TFR is hypothetical. It’s based on how many babies were born to women across five-year age groups (15 to 19, 20 to 24, and so on) in a given year. The TFR calculates the number of children a woman would have in her lifetime if she experienced these age-specific fertility rates throughout all her reproductive years.
The TFR hit its lowest point at 1.60 in 2024. That means the average U.S. woman would be expected to have 1.60 children in her lifetime if her fertility at every age matched rates in 2024.
The number of children ever born is simply the average number of children that women ages 40 to 44 – that is, those who have typically finished having children – have had. But this measure doesn’t tell us anything about fertility of younger women today. It also doesn’t capture a small but growing group of women who have children later in their 40s.
This number has hovered around 1.90 to 2.00 since 1990. It bottomed out in 2006, when women ages 40 to 44 had 1.86 children on average. As of 2024, the typical woman in her early 40s had 1.92 children.
Why do different fertility rates show different trends?The GFR and the TFR generally show similar downward trends. But the number of children ever born suggests more stability in recent decades. This is because the GFR and TFR are affected by when in life women have children, while children ever born is not.
It’s important to remember that the GFR and TFR reflect births of the present, not births over a woman’s lifetime. When women delay having children, there will typically be fewer births in a given year, which can lower the GFR and TFR. But if women go on to have children later in life, they may still have the same total number of children over their lifetimes as in previous generations.
The GFR and TFR have declined since the Great Recession, but the number of children ever born has remained steady since the early 1990s. Women are continuing to have children later in life, but whether younger women will have fewer children in their lifetimes than previous generations remains to be seen.
Why have fertility rates been falling?Many factors have contributed to declines in the GFR and TFR, including:
In 2025, we asked Americans what type of impact they think it would have on the U.S. if fewer people chose to have children.
Despite these concerns, a majority of Americans (56%) say the federal government should not have a role in encouraging more people to have children.
Among those who do think the government should play a role in this, two of six specific policies we asked about received majority support across political parties:
Related: Best age to get married, have a child, buy a home and retire? Here’s what Americans say
Note: This is an update of a post originally published Feb. 24, 2015, and written by former Senior Researcher Gretchen Livingston.

Jake Hays is a research associate focusing on social and demographic trends research at Pew Research Center.
| # | Наименование новости | Тональность | Информативность | Дата публикации |
|---|---|---|---|---|
| 1 | What's Behind Declining Birth Rates in the US? | 0 | 7.4 | 13-05-2026 |
| 2 | India's Fertility Rate is now 1.9: Is Population control outdated? | 0 | 17.1 | 22-09-2026 |
| 3 | American Birthday Accounts Can Help Solve Our Coming Population Problem | 0 | 9.22 | 10-08-2026 |
| 4 | Минтруд связывает падение рождаемости в России с низкими доходами семей | 0 | 0 | 08-06-2019 |
| 5 | Africa: Young People Value Partnership and Parenthood but Barriers Block Their Dreams | 0 | 7 | 08-07-2026 |
| 6 | Are Americans sleeping more or less? | 0 | 7.35 | 20-01-2026 |
| 7 | Fewer children, more seniors as fertility drops across Maghreb | 0 | 6.94 | 13-08-2026 |
| 8 | India’s population will soon be falling—probably quite fast | 0 | 9.15 | 04-06-2026 |
| 9 | If we don’t face WHY men are giving up on work, America’s future is grim | 0 | 9.1 | 16-08-2026 |
| 10 | Warum sich die Politik nicht über die sinkende Geburtenrate wundern sollte | 0 | 5 | 02-07-2026 |