Просмотр новости
Найдите то, что Вас интересует
 Спутники
 РН
РН SpaceX
 Роскосмос
 NASA
NASA
СпутникиРНSpaceXРоскосмосNASAThousands of Asians and Pacific Islanders have already been swept into the Trump administration’s aggressive immigration enforcement campaign. In this blog, we look beyond the numbers to understand which communities are getting hit the hardest and why.
The post How Asians and Pacific Islanders Are Being Impacted by ICE | What the Data Reveals appeared first on Stop AAPI Hate Action.
In July 2026 alone, Immigration and Customs Enforcement (ICE) made nearly 50,000 arrests — the highest single-month total since Trump returned to office. But this surge goes far beyond July. From his inauguration through August 6, 2026, there have been 555,805 arrests, 509,414 detentions, and 398,324 deportations, including a growing number of people from Asian and Pacific Islander (A/PI) countries.
To learn more about how A/PIs in the U.S. are being impacted by the Trump administration’s mass deportation operation, Stop AAPI Hate created the Asian and Pacific Islander (A/PI) ICE Tracker — showing which A/PI communities are most affected, where enforcement is concentrated, and how patterns are shifting over time.
The Asian and Pacific Islander ICE Tracker draws on data obtained from ICE through Freedom of Information Act requests by the Deportation Data Project. This analysis covers the period of January 20, 2025 through August 6, 2026.
This post highlights key findings from the latest A/PI ICE data covering Trump’s second term up until August 6, 2026 and draws on conversations with community partners to explore the histories and policies that might help explain the patterns we see.
Remember: Behind the numbers are real people, including many long-term U.S. residents, who have faced detention in inhumane conditions, separation from their families, loss of their livelihoods, and, for some, deportation to places where they face grave danger. By making the impacts of ICE more visible, we can better hold ICE accountable and strengthen efforts to protect immigrant communities.
Use the links to navigate to different parts of this blog post.
Asian:
Pacific Islander:
* People from Laos include Hmong, Iu Mien, Khmu, Lao, Tai Dam, and other ethnic groups.
** People from Vietnam include Montagnard, Cham, Khmer Krom, and other ethnic communities.
Thousands of Asians and Pacific Islanders have already been swept into the Trump administration’s aggressive immigration enforcement campaign.
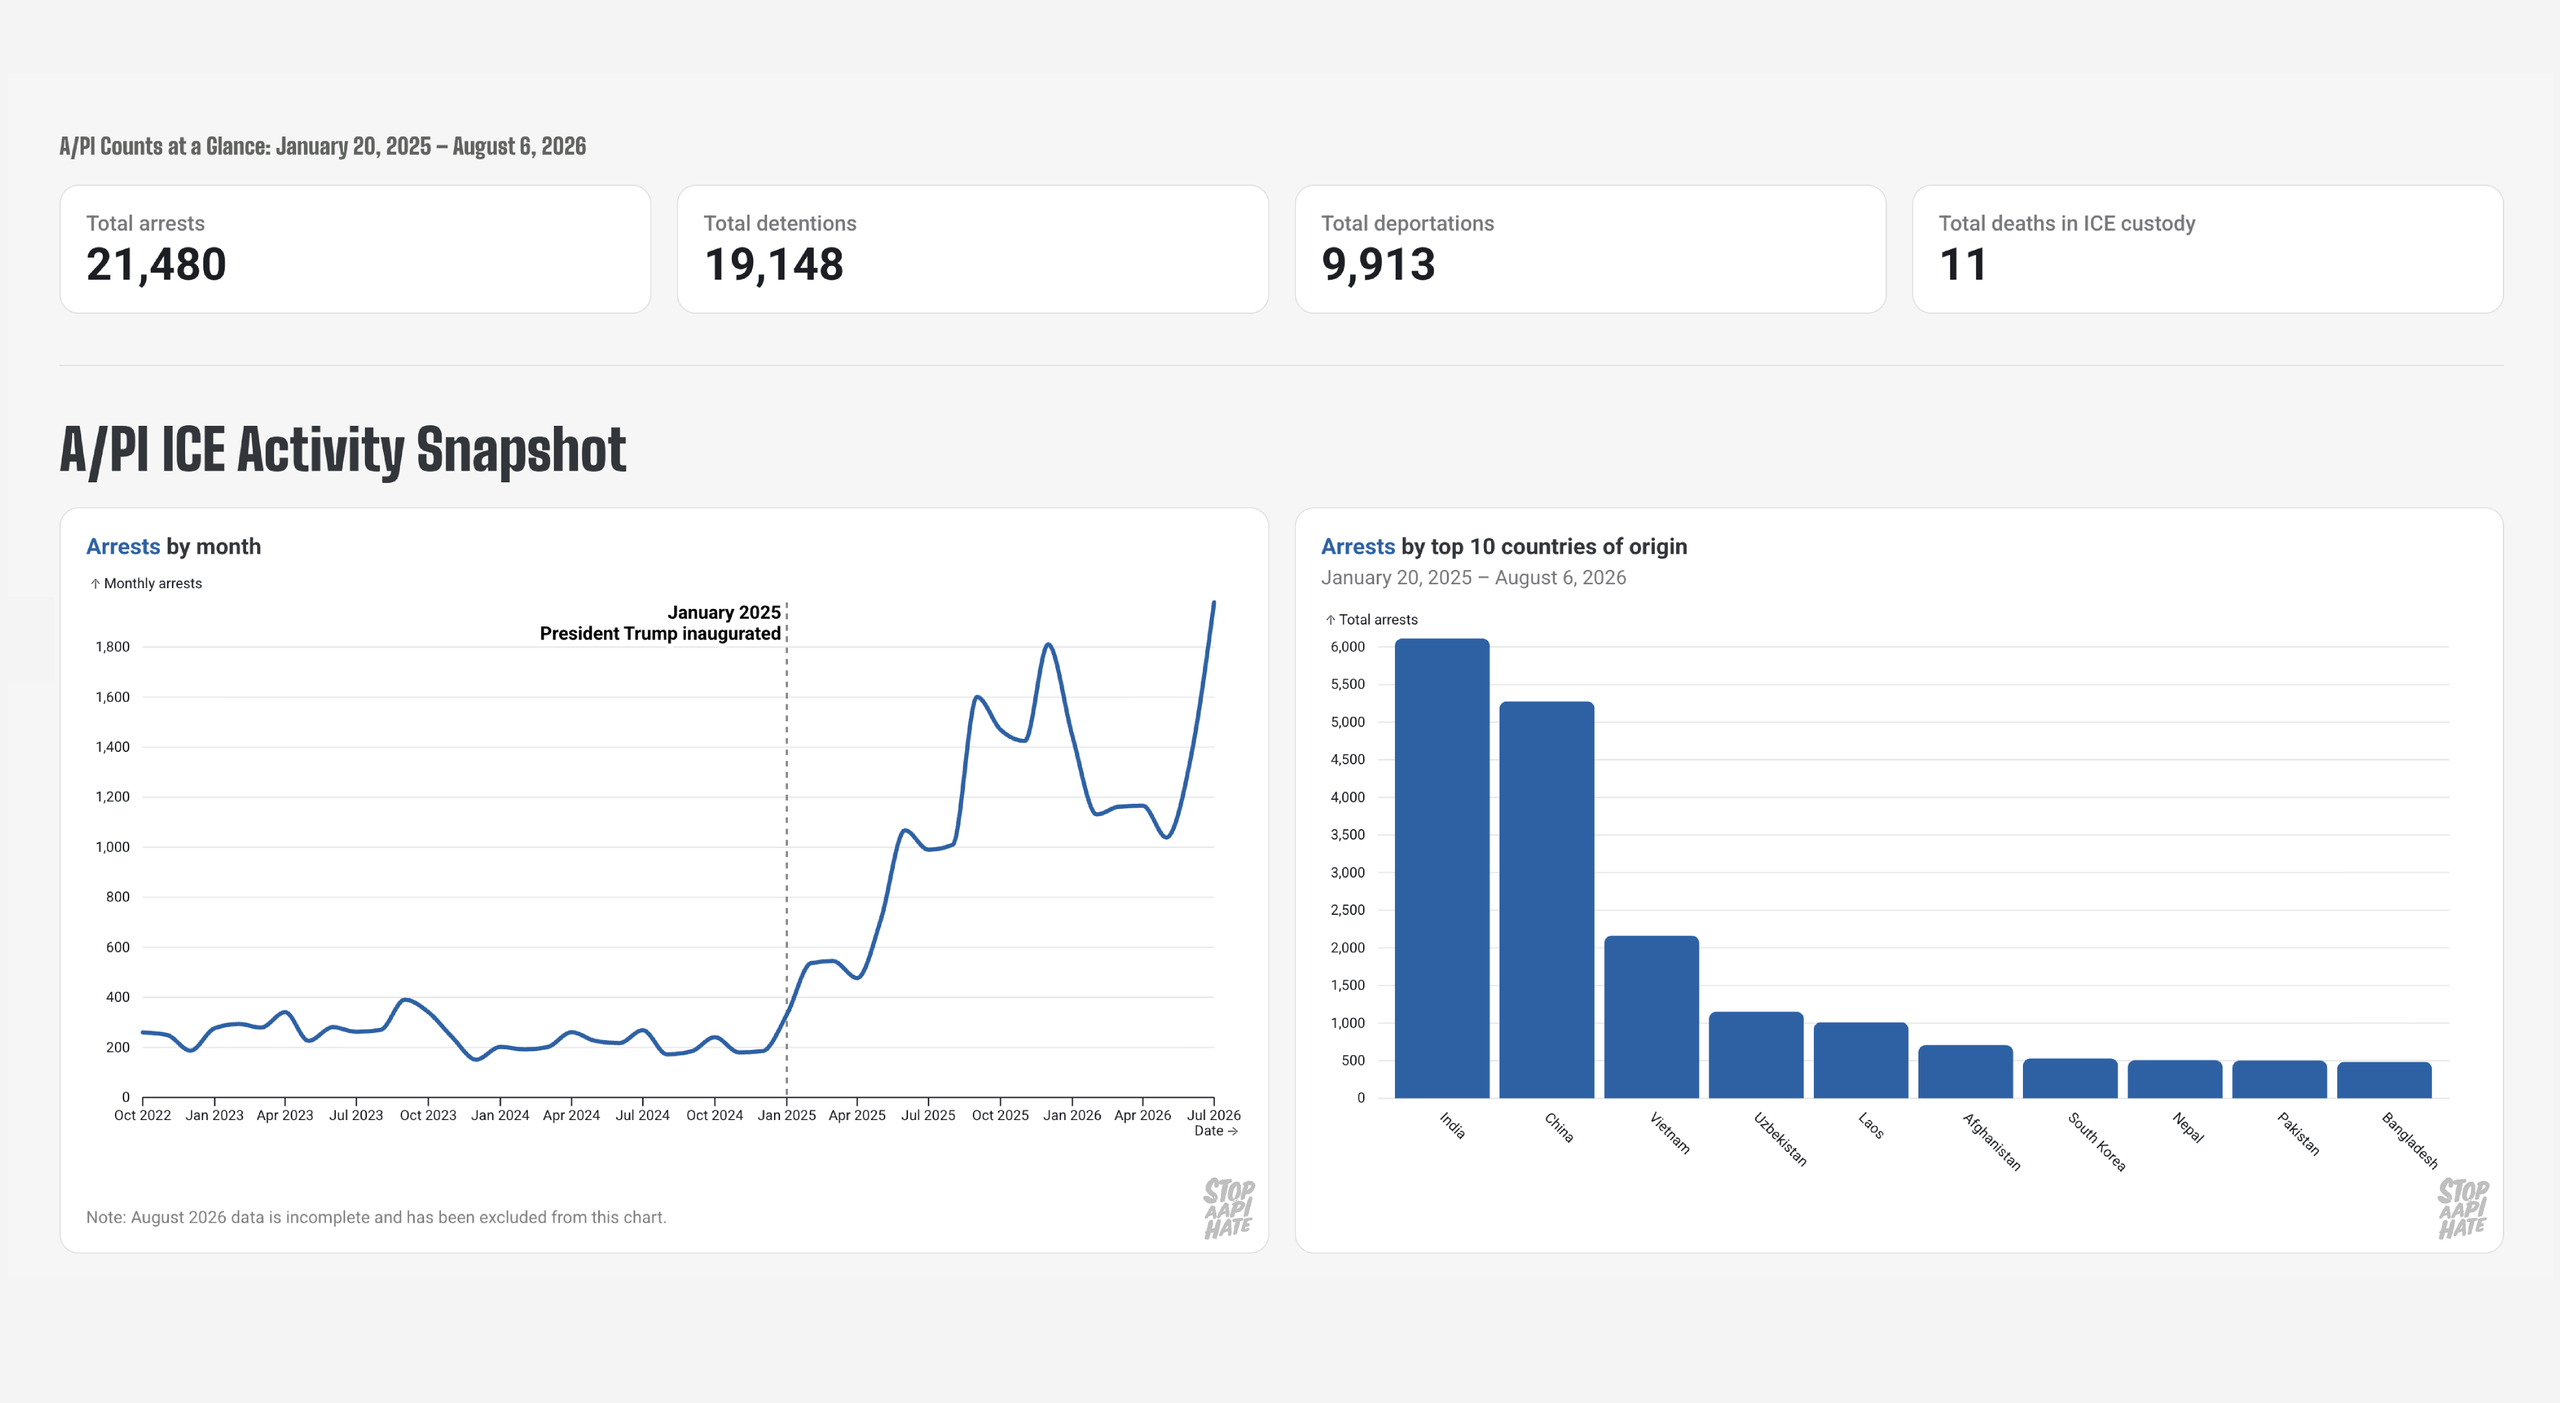
Between President Trump’s second inauguration and August 6, 2026, there were 21,480 ICE arrests of Asian and Pacific Islanders, 19,148 detentions, and 9,913 deportations. Eleven people from Asian countries died in ICE custody in the same period. (The death count has since grown to twelve, after a Chinese man died in detention on August 23, 2026.)
While ICE activity has increased across the board, the rise of Asian arrests, detentions, and deportations has been far steeper. In July 2026, Asian arrests reached a monthly high under Trump’s second term, nearly 2,000.
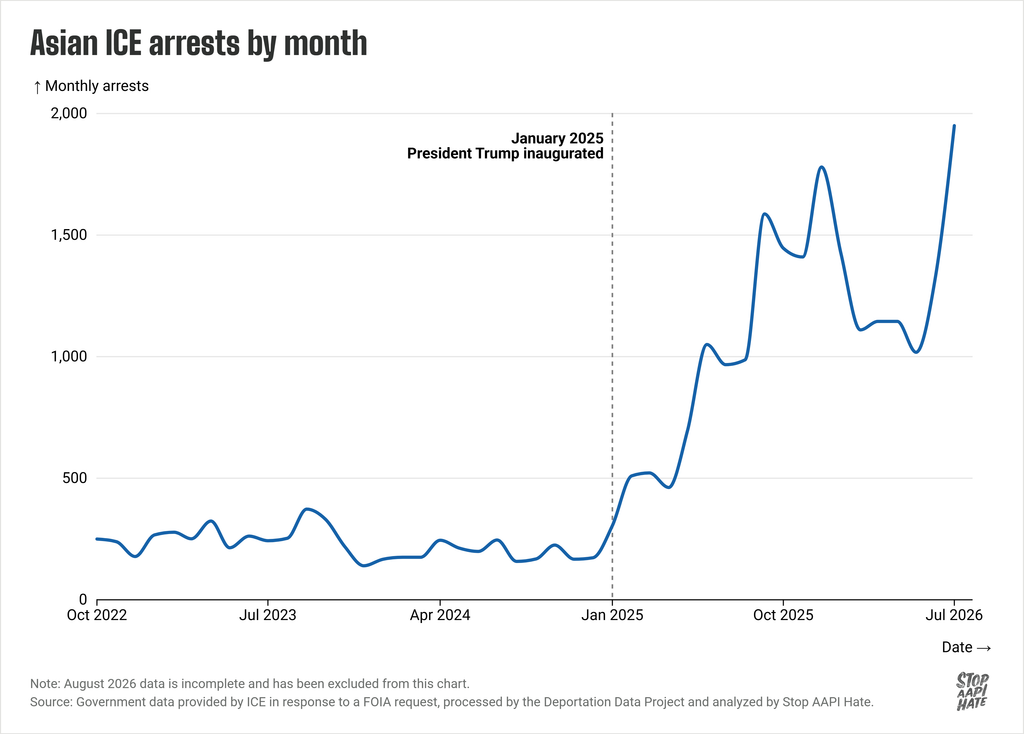
Relative to an equivalent period under the previous administration, overall arrests rose 219%, detentions rose 280%, and deportations rose 356% during the second Trump administration. Among Asian people, however, arrests rose 436%, detentions rose 512%, and deportations rose 1,103%.
Among Pacific Islanders, arrests under the second Trump administration increased 25%, detentions increased 34%, and deportations increased 33%.
These totals reveal the scale of enforcement. But they don’t tell us which communities are getting hit the hardest.
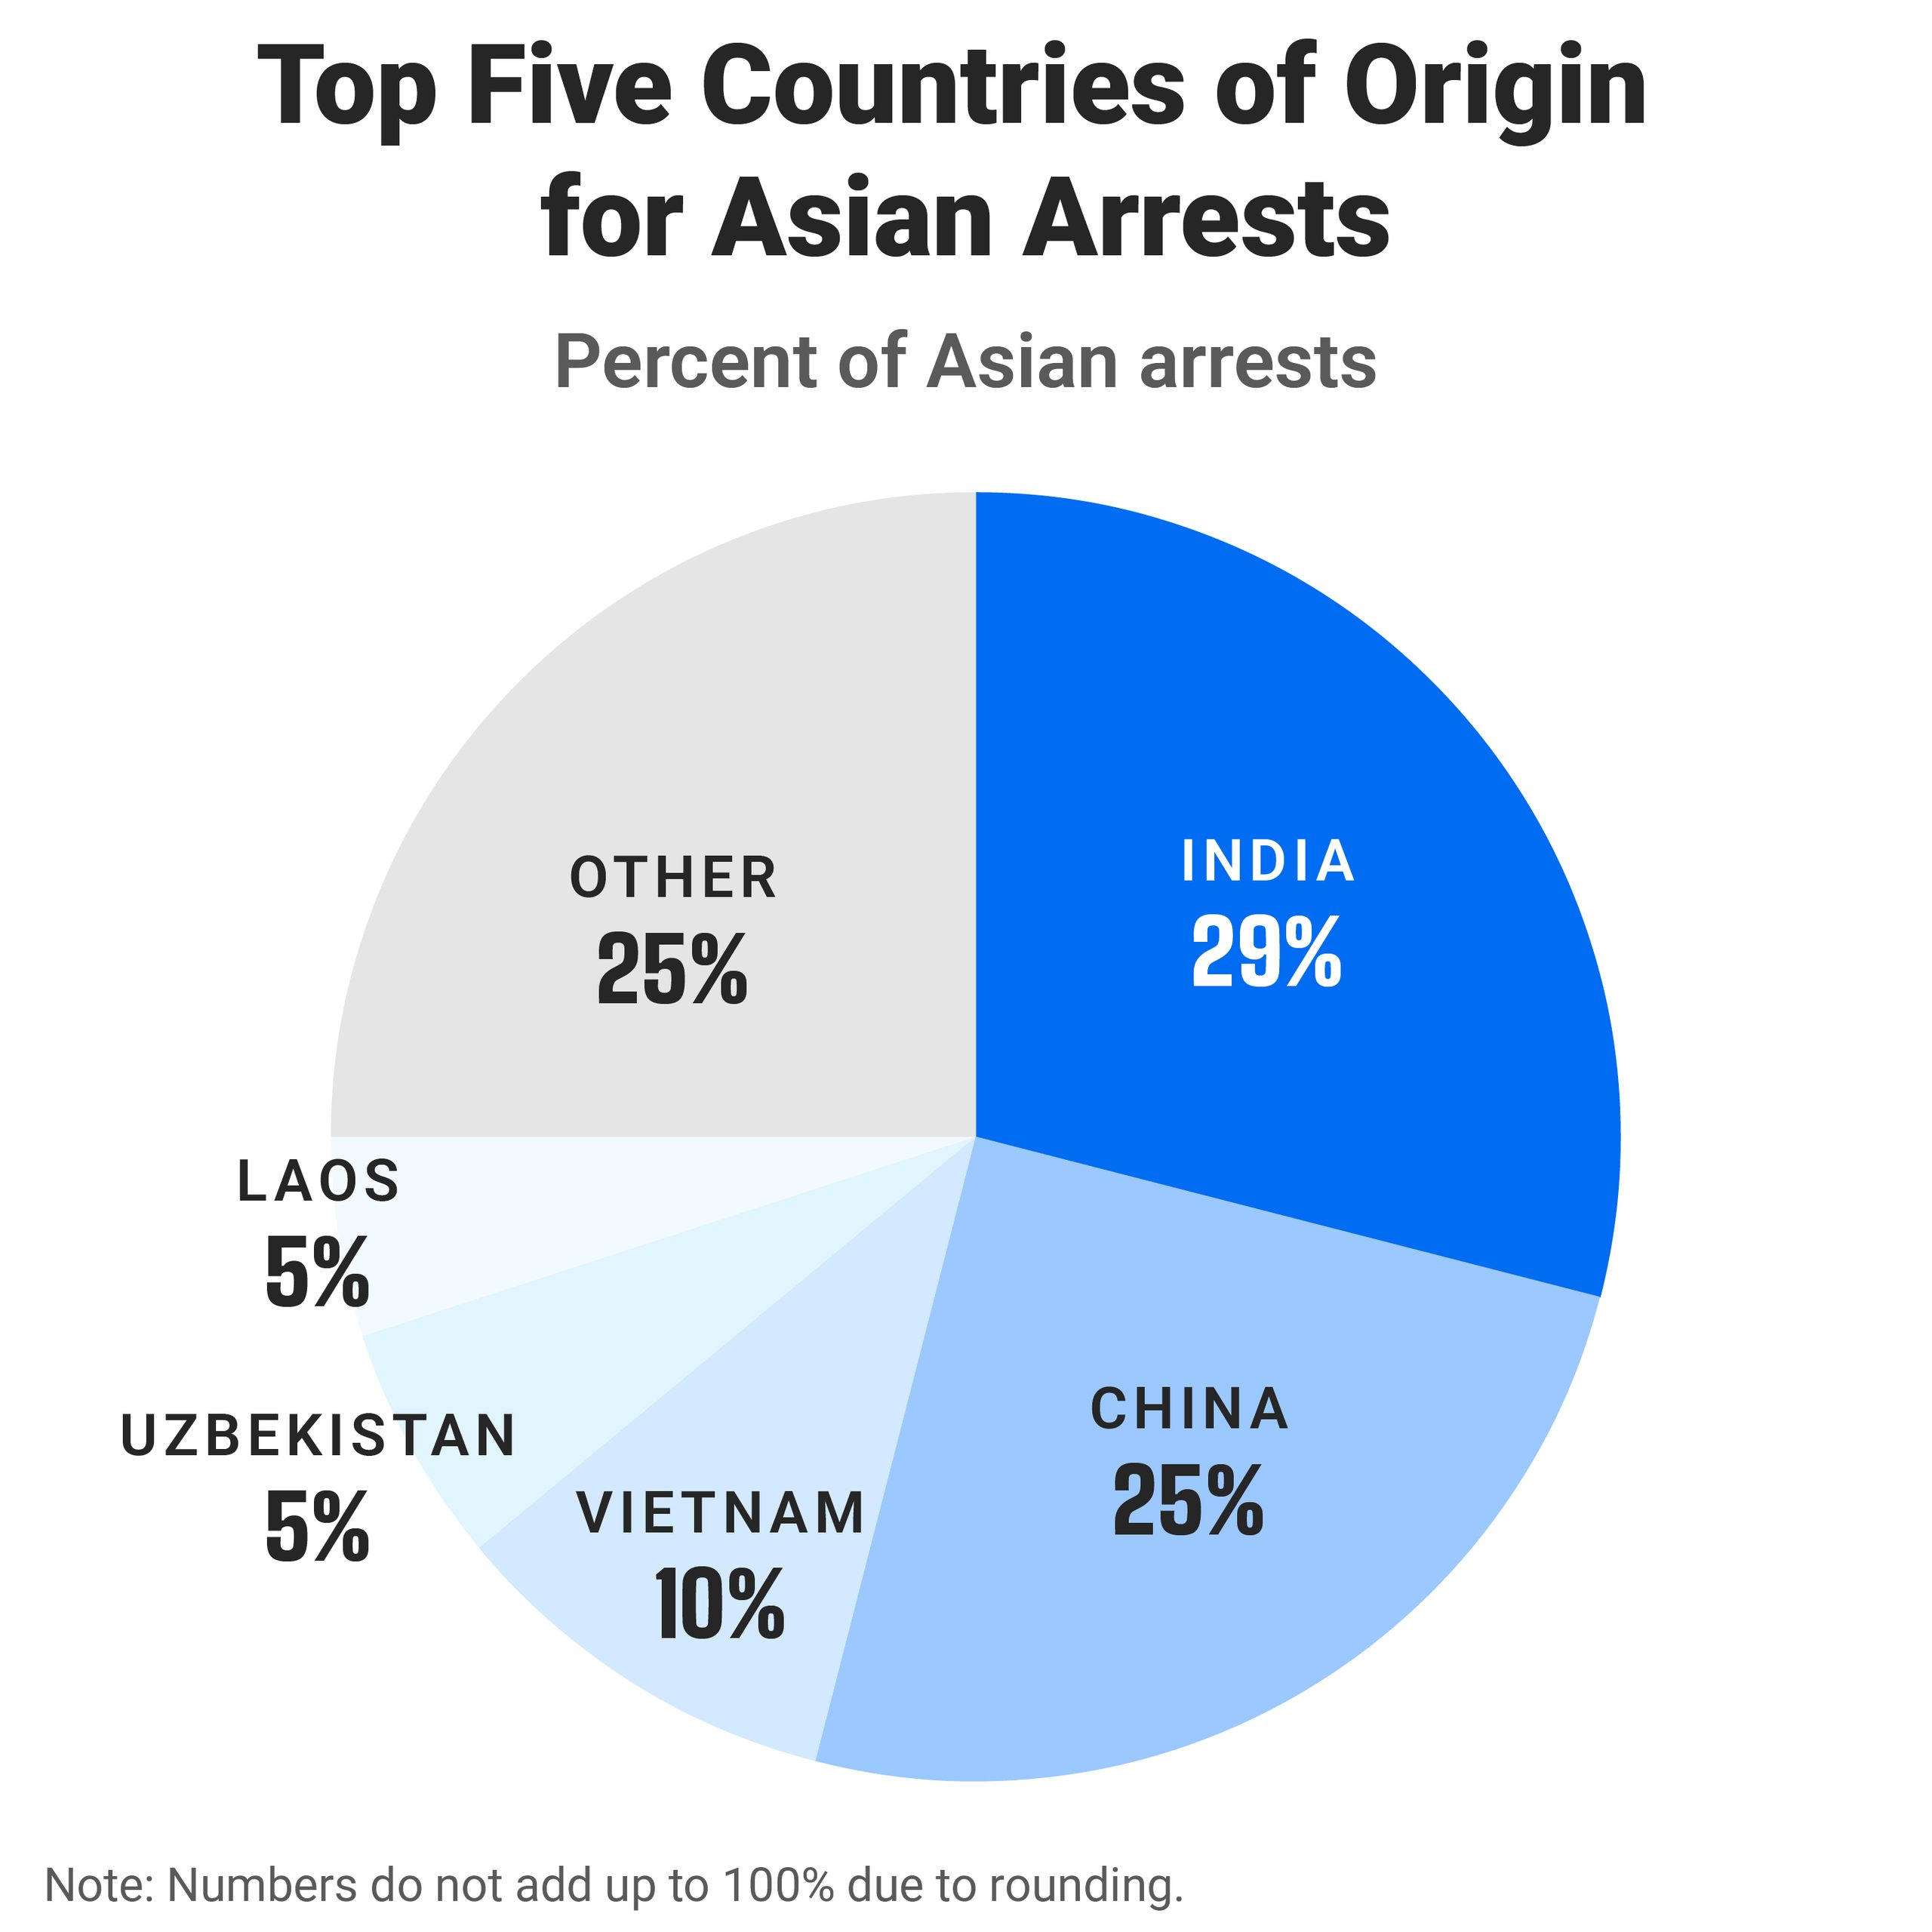
ICE has devastated a wide range of A/PI communitiesWhich Asian communities have been hit the hardest?Of the Asian arrests, detentions, and deportations, the largest shares involved people from India, China, Vietnam, Uzbekistan, and Laos.
🔖 Defining A/PI ICE actions
To standardize our analysis, we use ICE’s “citizenship country” field to identify actions involving A/PI people because ICE does not consistently include race data in its releases or collect detailed A/PI ethnicity data. While we use this field to identify A/PI-related records, we do not use ICE’s citizenship terminology.
🔖 Defining “country of origin”
Throughout our A/PI ICE Tracker, we say “country of origin” and “people from _____” instead of “citizenship country” and “citizens.” This is because ICE’s “citizenship country” category does not always reflect a person’s actual citizenship status. Refugees and stateless people may not be recognized as citizens by their listed “citizenship country.”
For more detailed statistics on all Asian countries, check out the Asian and Pacific Islander ICE Tracker.
For the two largest Asian noncitizen populations in the U.S. — Indian and Chinese — their share of ICE actions roughly corresponds with their share of the Asian noncitizen population. For example, people from India accounted for 27.9% of Asian detentions and 30.7% of Asian noncitizens. People from China accounted for 24.9% of Asian detentions and 21.9% of Asian noncitizens.
But the same cannot be said of people from Uzbekistan, Laos, and Vietnam who have faced ICE actions disproportionate to their shares of the Asian noncitizen population.
Raw numbers alone can’t tell us which groups have borne the brunt of the impact. For example, let’s take a look at detentions again. When we account for population share, the most overrepresented A/PI communities tend to fall into one of two categories: Central Asian and historical refugee populations. We also see an overrepresentation of ICE actions among people from Indonesia.
🔎 What’s happening here? The disproportionate impact of ICE actions involving people from Central Asian countries requires additional investigation. Limited research and community information make it difficult to fully understand what may be driving these patterns. However, one development that may be contributing to the recent increase in deportations is a landmark agreement between the Trump administration and the Uzbek government in April 2025. In the weeks and months following the announcement, Uzbekistan financed several deportation flights — accepting hundreds of Uzbekistani as well as Kyrgyzstani and Kazakhstani people.
Southeast Asian
🔎 What’s happening here? For Southeast Asian refugees, today’s disproportionate impact can be traced back to the 1990s. In that decade, there was a rapid expansion of the carceral system and over-policing of low-income communities of color. At the same time, federal legislation broadened the range of crimes that could lead to deportation and limited due process protections for noncitizens, reinforcing a prison-to-deportation pipeline.
Uprooted by the Vietnam War and related U.S. military intervention in Southeast Asia in the 1950s-1970s, and the upheaval and violence that followed, Southeast Asian refugees have faced devastating consequences from these structural changes: double punishment, family separation, and deportation back to countries from which they were forcibly displaced.
As the Trump administration has expanded immigration enforcement, some of them are getting arrested at routine immigration check-ins that they have attended for years without incident, reported Southeast Asia Resource Action Center (SEARAC) and Southeast Asian Freedom Network (SEAFN). Many came here as children in the 1970s and 1980s and have spent their entire adult lives in the U.S.
Bhutanese
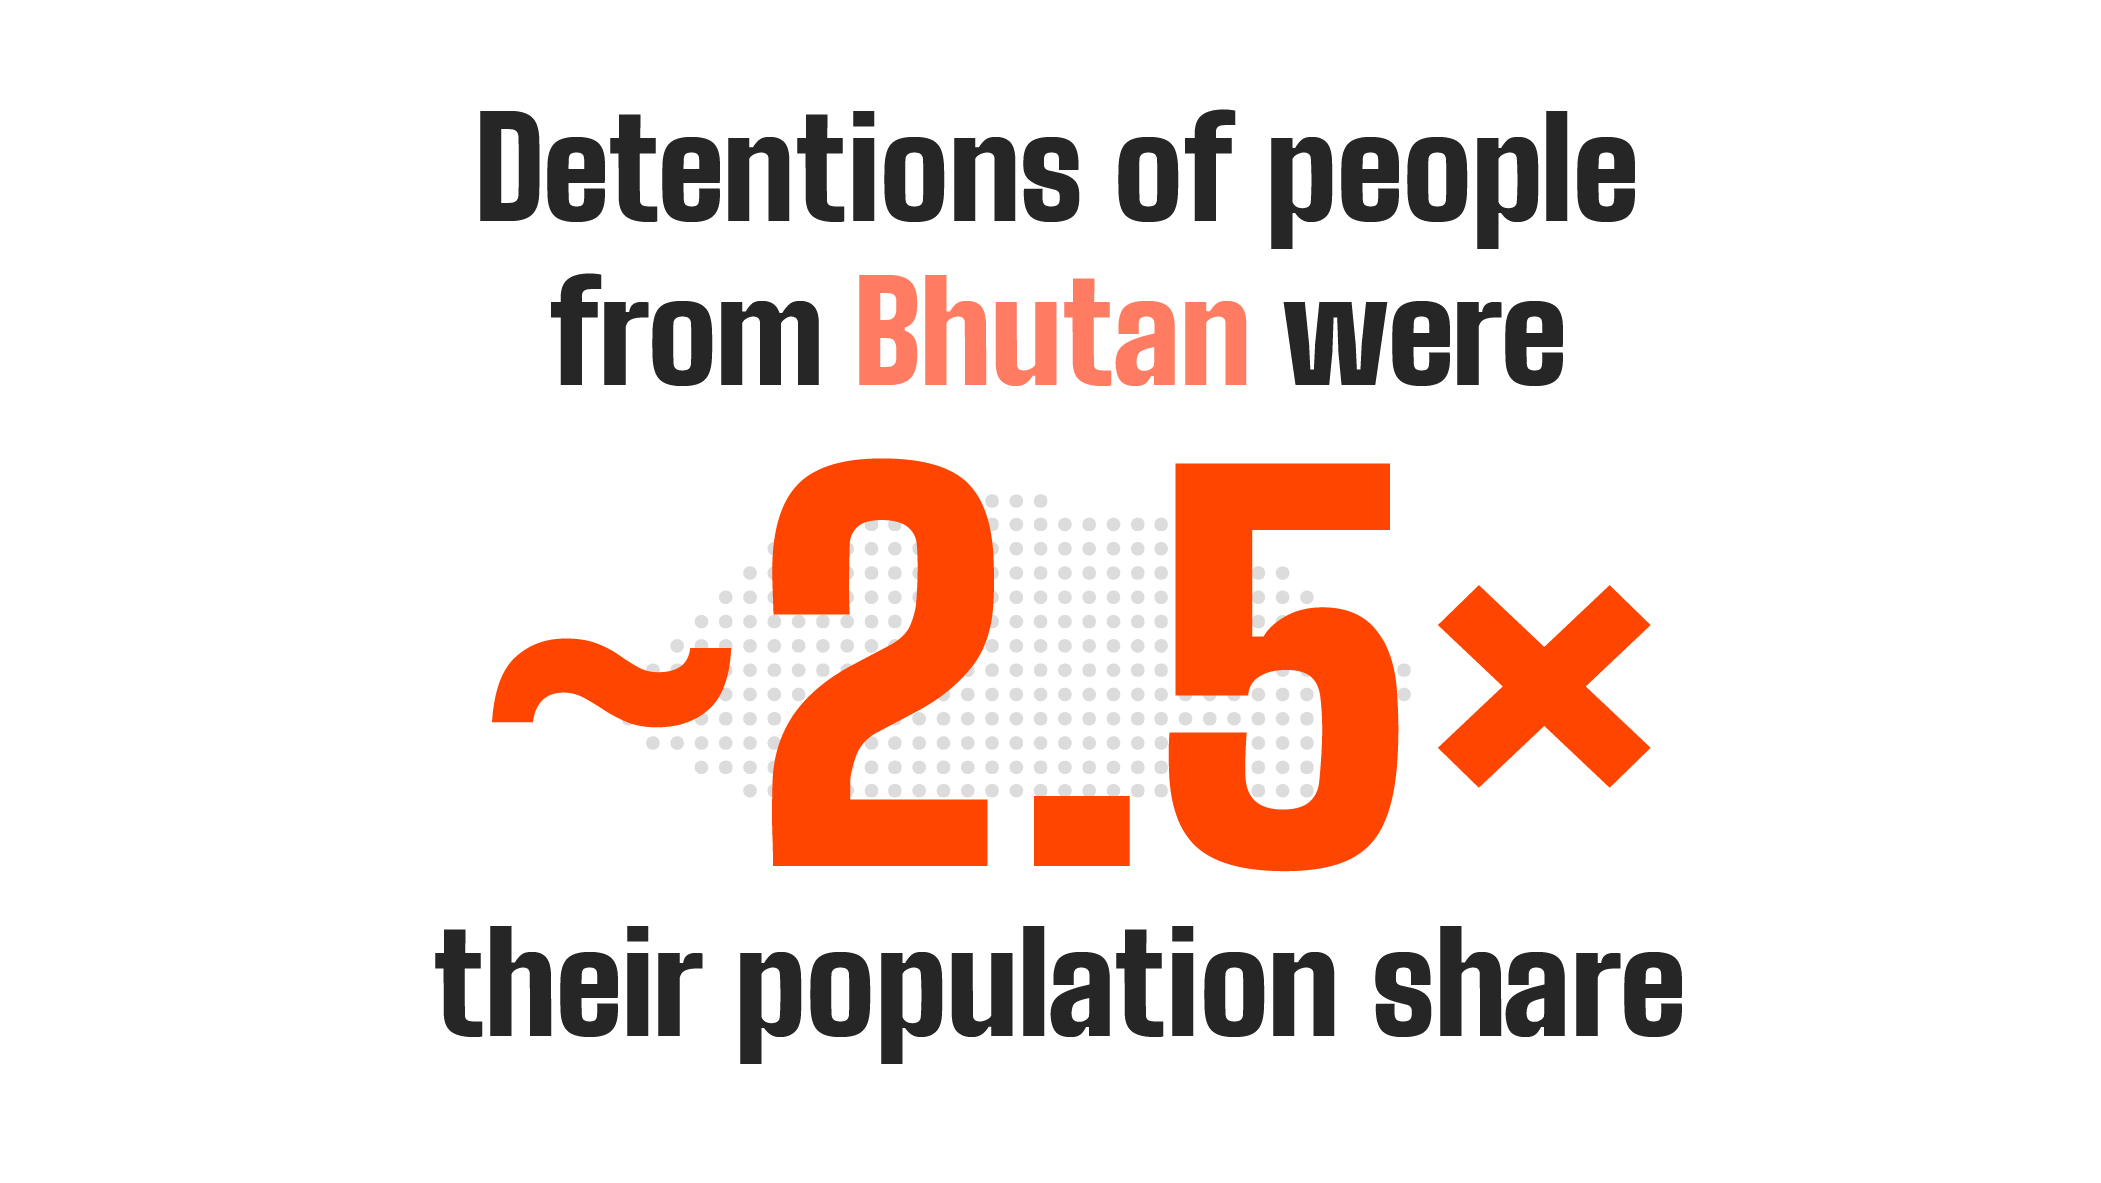
🔎 What’s happening here? Nepali-speaking Bhutanese refugees have a different history, but are now being swept into the same prison-to-deportation pipeline. They resettled in the U.S. starting in the late 2000s after being expelled from Bhutan during an ethnic cleansing campaign and spending years — often decades — in refugee camps in Nepal. They have since built lives and communities here.
But now, as Trump continues to ramp up deportations, Nepali-speaking Bhutanese are getting deported back to the very place that persecuted them. Despite Bhutan’s longstanding refusal to recognize them as citizens, in 2025 the U.S. began deporting Nepali-speaking Bhutanese refugees there.
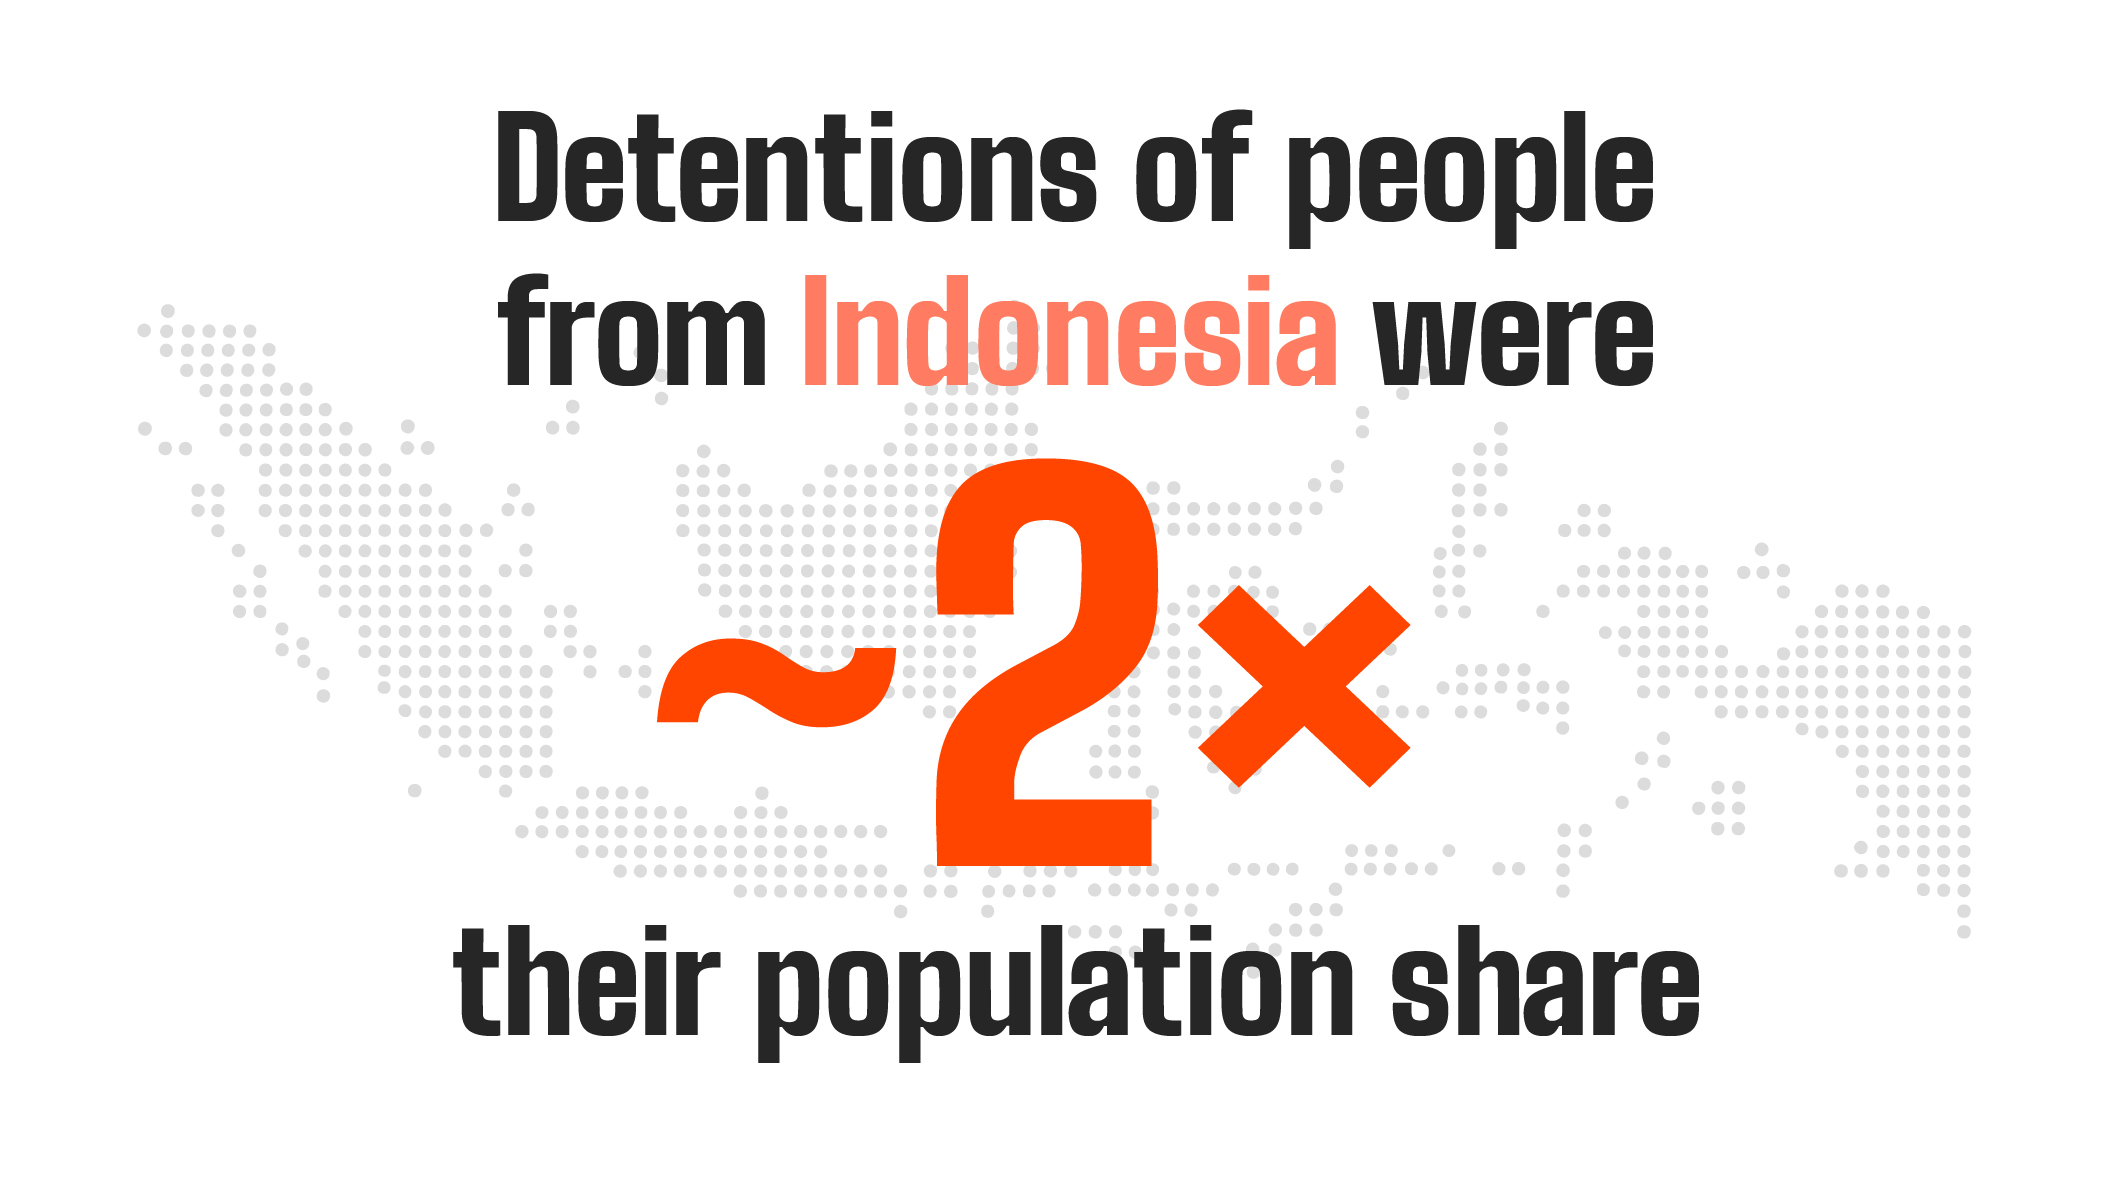
🔎 What’s happening here? One likely factor: in 2024, nearly 1 in 10 Indonesia-born non-U.S. citizens had non-detained final removal orders, one of the highest rates among Asian countries in our analysis. Many have lived in the U.S. for decades — including Chinese Indonesian Christians who fled religious and ethnic persecution in the late 1990s and settled in New Jersey and Philadelphia, where some were denied asylum and ordered deported. Thanks to the advocacy of local churches, some were allowed to stay as long as they regularly checked in with ICE.
Under the Trump administration’s expanded deportation campaign, however, they and other people with longstanding removal orders face a much greater risk of detention and deportation. Further investigation is needed to understand other factors that may be contributing to the disproportionate impact of ICE on people from Indonesia.
📏 Measuring “disproportionality”
In order to understand whether people from a particular country are disproportionately impacted by ICE relative to the size of their population, we compare their share of ICE actions with their share of the Asian-born non-U.S. citizen population — the best available data for approximating those who are vulnerable to immigration enforcement actions. We get this population data from the U.S. Census Bureau’s 2020-2024 5-year American Community Survey (ACS) using IPUMS.
ACS does not provide estimates for every country of birth. As a result, we cannot assess disproportionality for these countries, and they are not included in the population totals for our calculations. These limitations make our comparisons estimates, not exact measures of disproportionality.
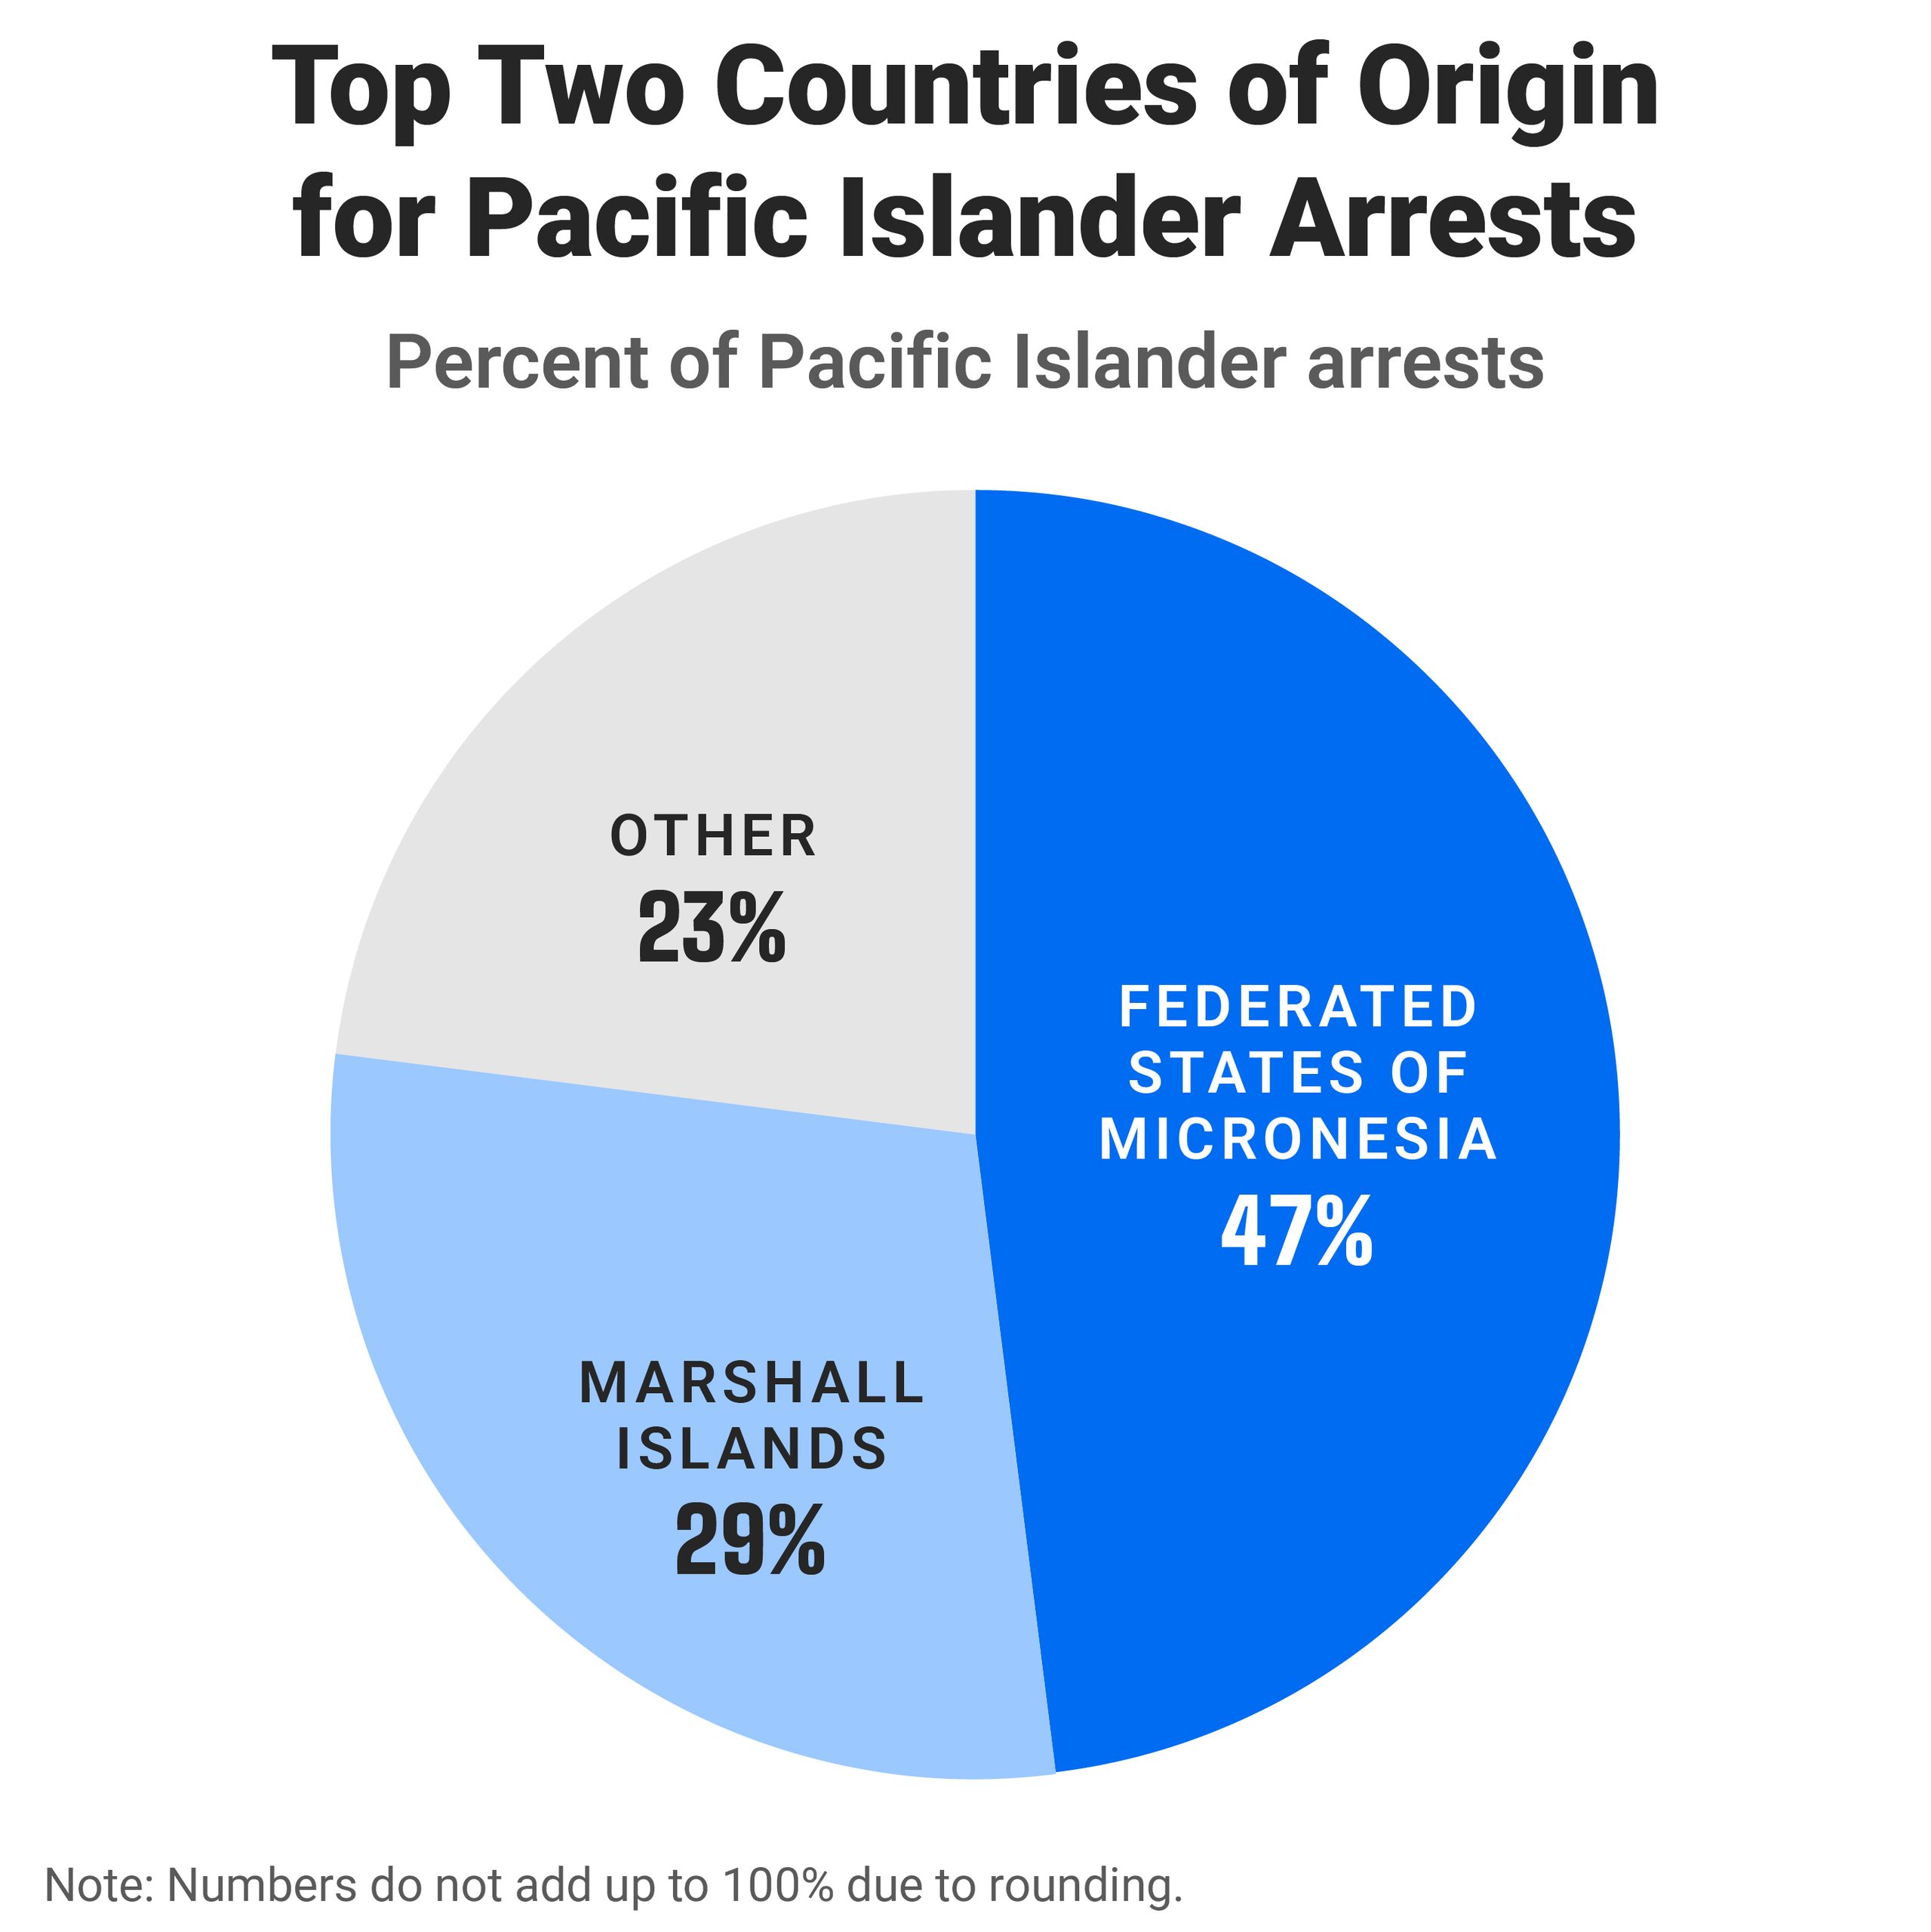
Of the Pacific Islander arrests, detentions, and deportations, people from the Federated States of Micronesia and the Marshall Islands accounted for the most in each enforcement category.
People from the Federated States of Micronesia made up about half of all three enforcement actions, while people from the Marshall Islands accounted for 29.4% of arrests, 29.3% of detentions, and 35.3% of deportations.
Both nations’ shares of ICE actions track with their share of the Pacific Islander-born non-U.S. citizen population (or “Pacific Islander noncitizens” in this analysis). This alone is not unusual, but their outsized presence in the ICE data is significant because people from the Federated States of Micronesia and the Marshall Islands have a distinct legal status in the U.S. Per the Compacts of Free Association (COFA), they are legally permitted to live and work in the U.S. without a visa. Yet their distinct and often misunderstood legal status can leave them vulnerable in the U.S. immigration system.
For more detailed statistics on all PI countries, check out the Asian and Pacific Islander ICE Tracker.
ICE arrests are happening across the countryAsian and Pacific Islander people are not being arrested in only a handful of border states or major cities.
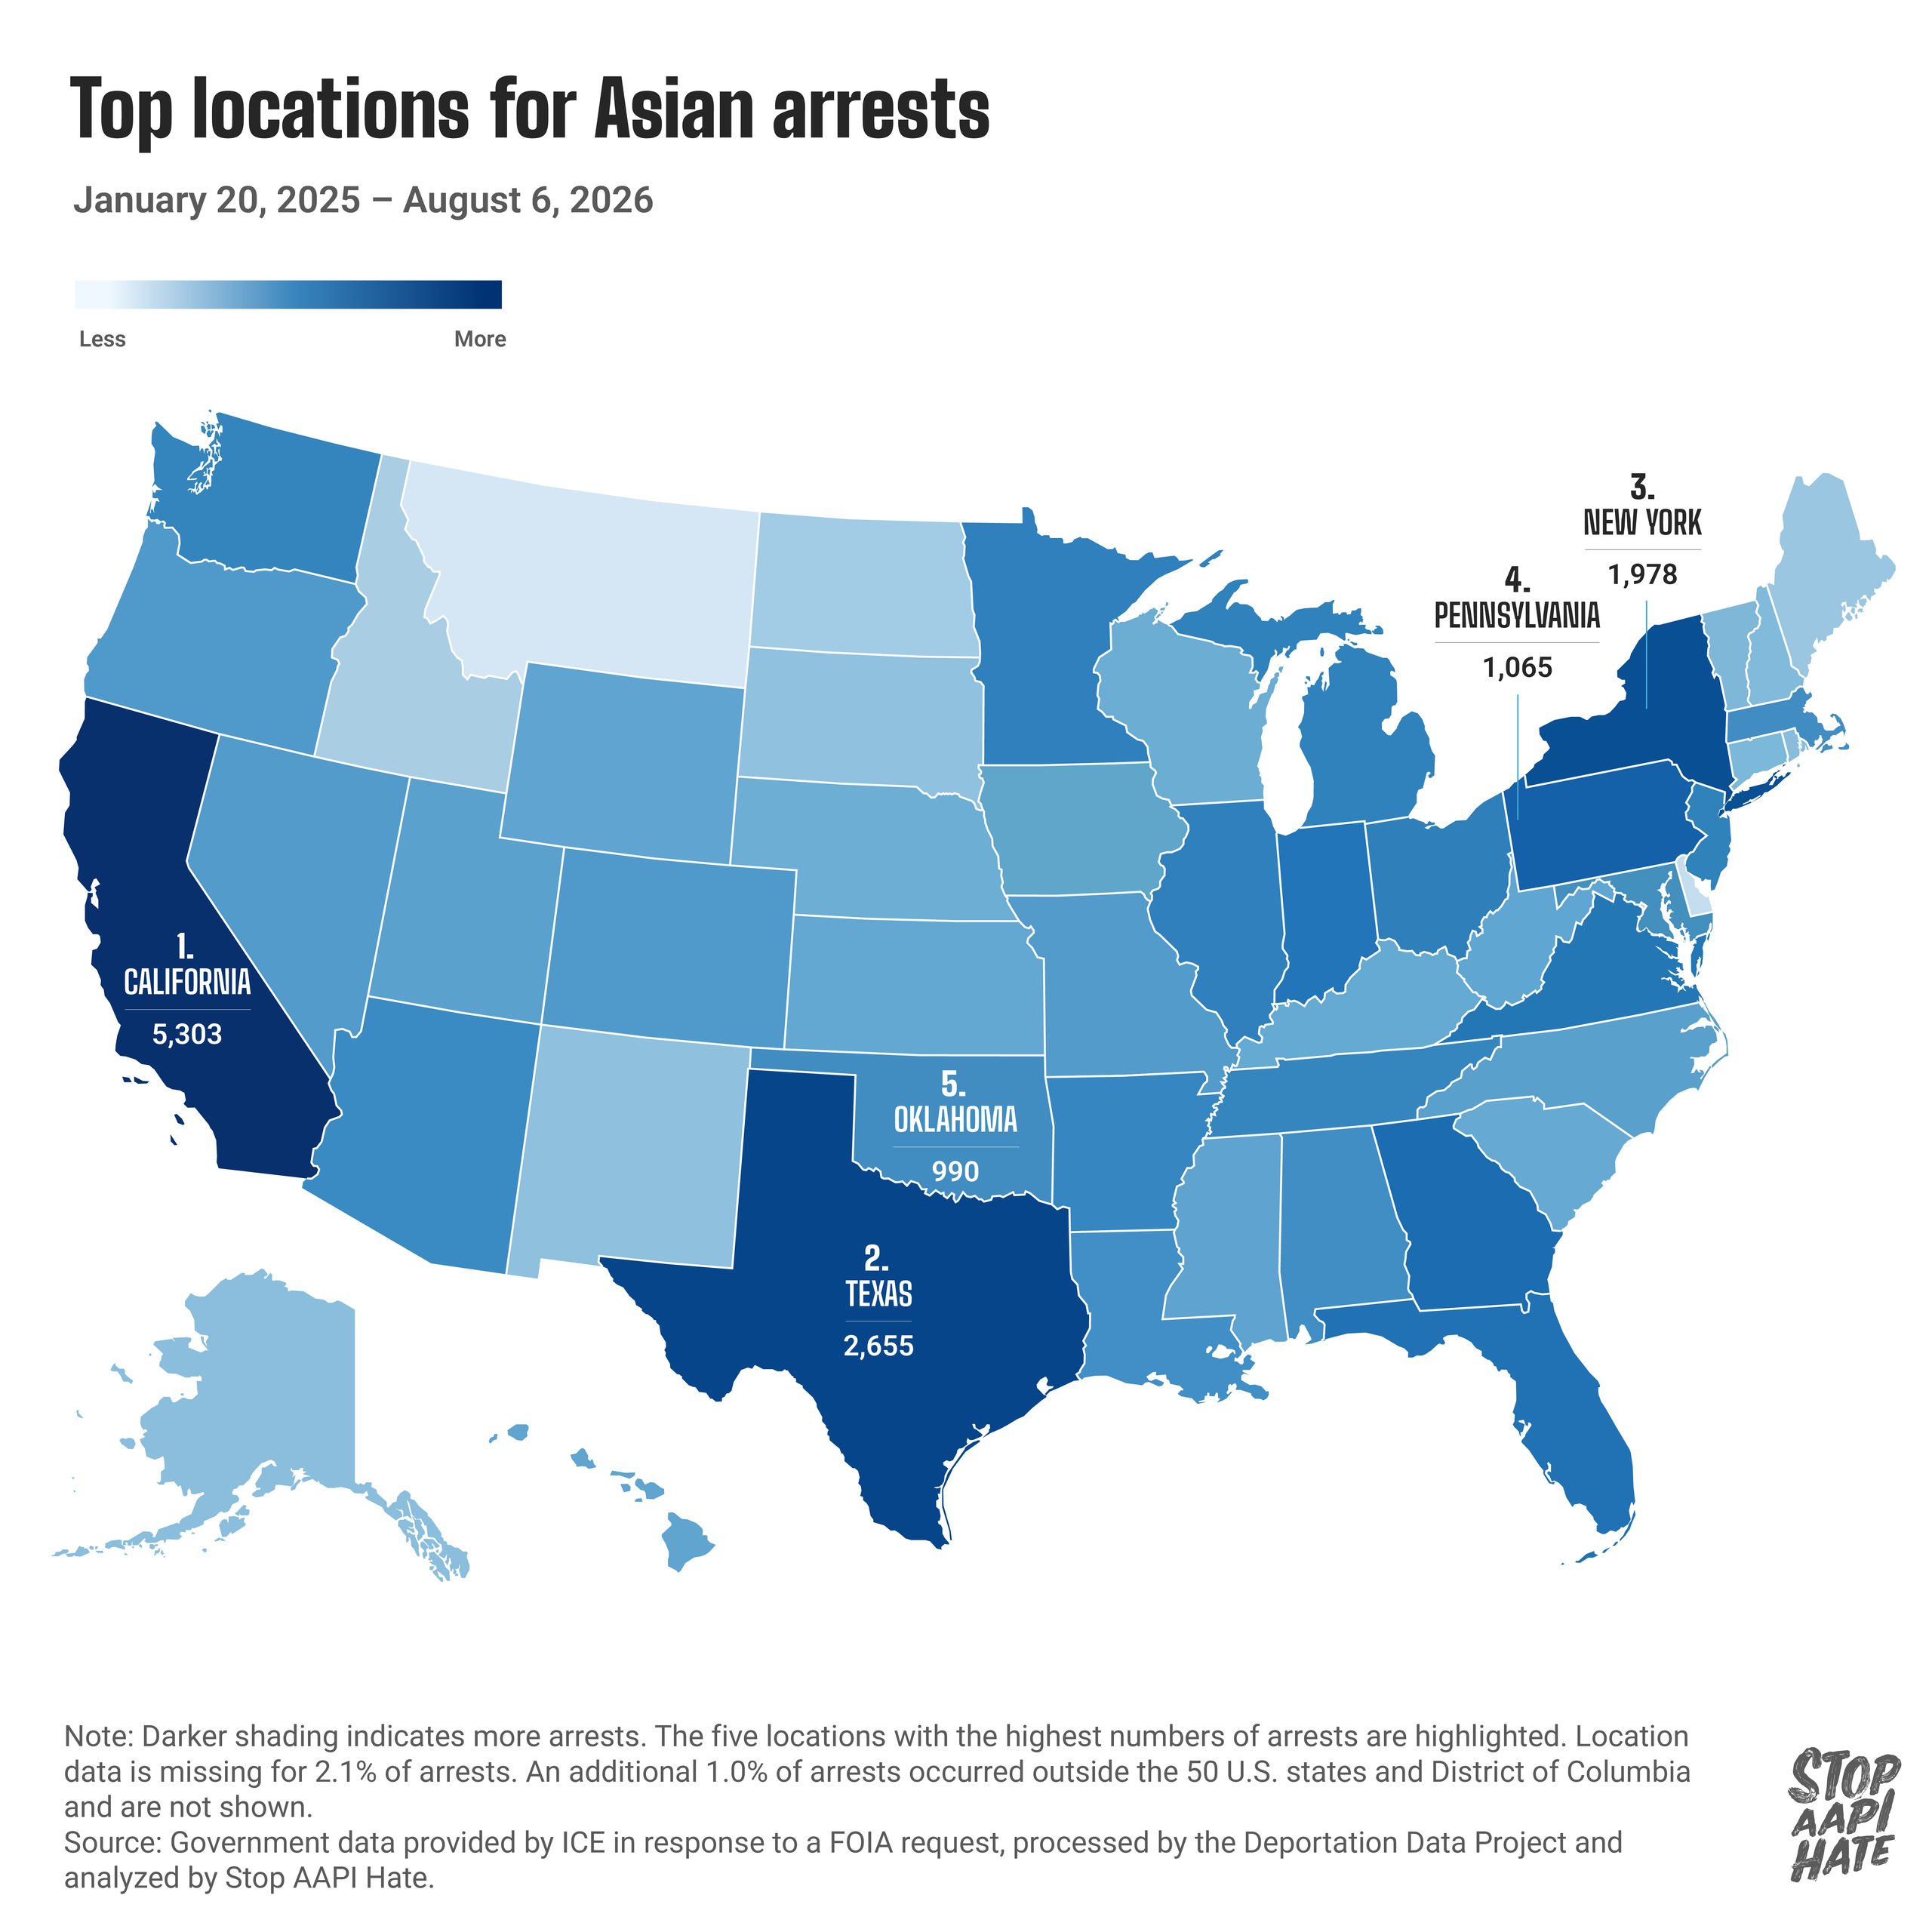
The largest numbers of Asian arrests occurred in California, Texas, and New York, followed by Pennsylvania, and Oklahoma.
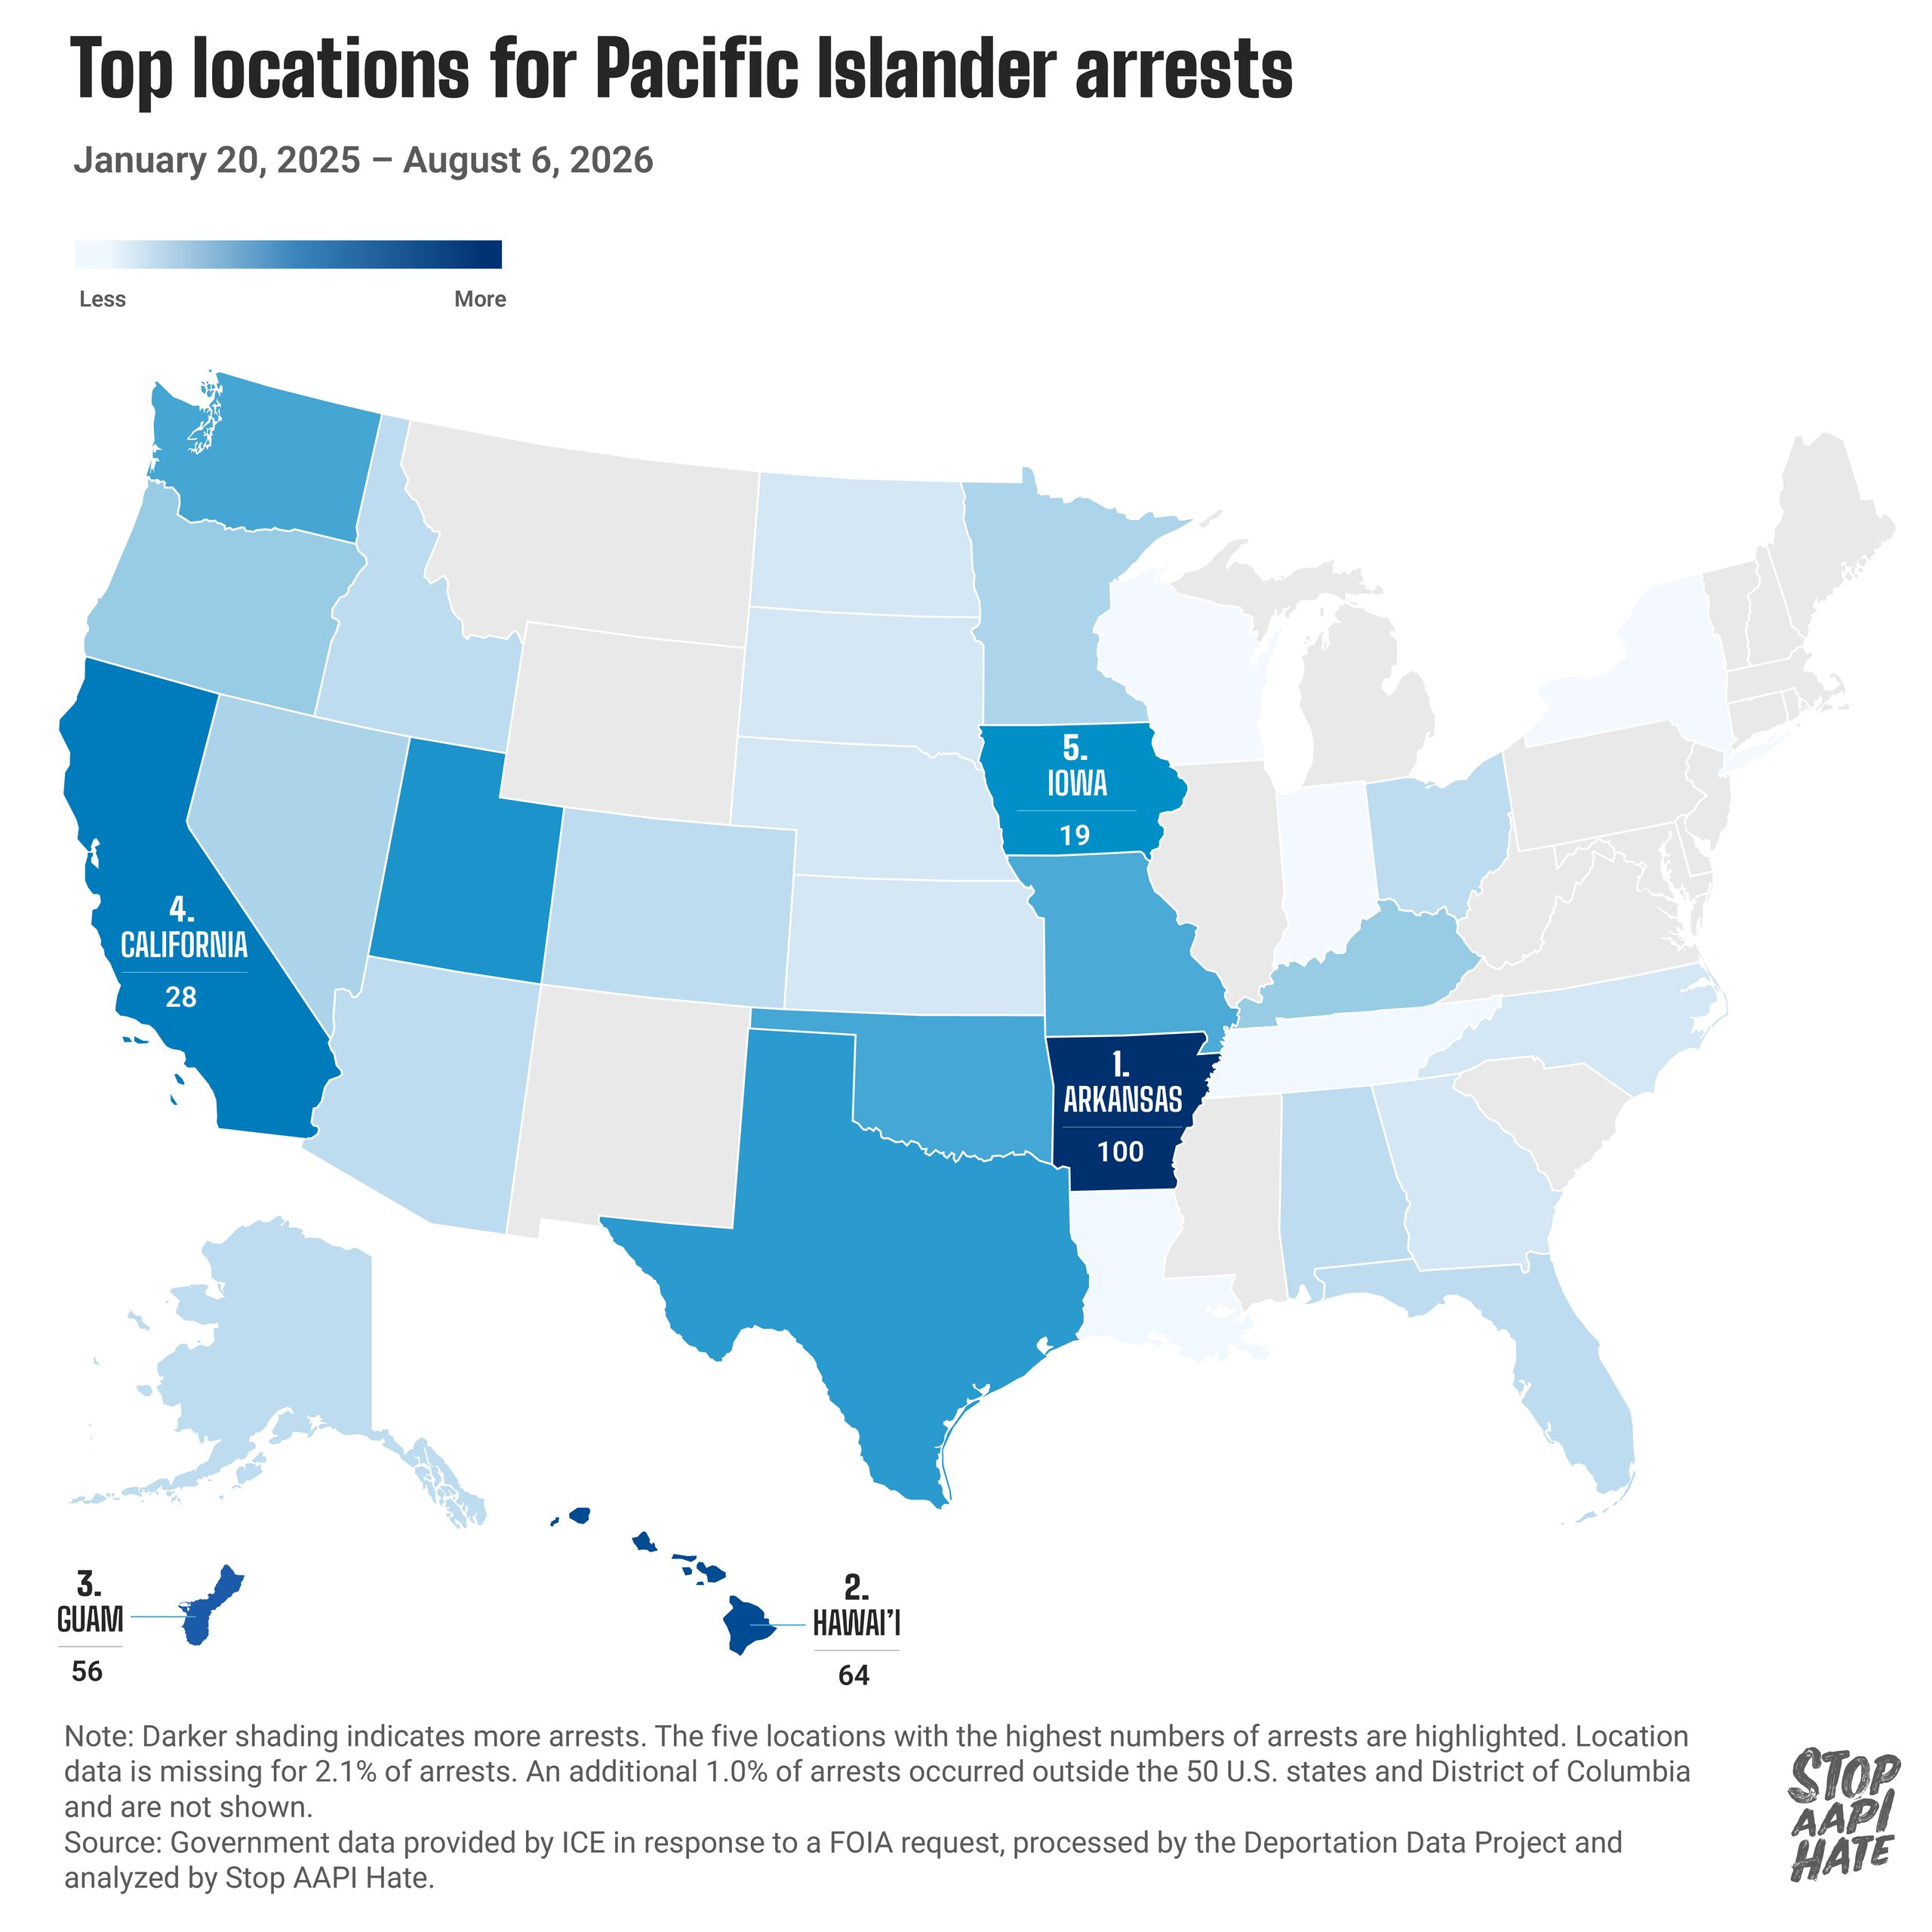
The largest shares of Pacific Islander ICE arrests occurred in Arkansas, Hawai’i, Guam, California, and Iowa.
But raw counts tell only part of the story. Comparing arrests with each state’s share of the Asian or Pacific Islander noncitizen population helps identify where immigration enforcement is especially concentrated relative to population size. Among the top 15 states for Asian arrests, Oklahoma, Indiana, Minnesota, and Pennsylvania stand out as having disproportionately high shares of Asian arrests. Oklahoma’s share of Asian arrests was over 9 times its share of the U.S. Asian noncitizen population, while Indiana, Minnesota, and Pennsylvania’s shares were around twice their shares of the U.S. Asian noncitizen population.
Among the top 15 places for Pacific Islander arrests, Arkansas stands out the most as its share of Pacific Islander arrests was around 3.5 times its share of the U.S. PI noncitizen population.
Let’s take a closer look at what is happening in some of these states and the particular communities being impacted.
People from Laos in MinnesotaMinnesota is home to just 9.0% of non-U.S. citizens born in Laos, and yet 18.3% of arrests of people from Laos have occurred there — twice their share of the population. Since ICE doesn’t record ethnicity, it’s difficult to know for sure which ethnic groups are being impacted. Many of those classified as Laotian “citizens” in ICE data are likely Hmong, especially in Minnesota, where Hmong make up the largest Asian population. Among non-U.S. citizens in Minnesota who were born in Laos, 75% are Hmong, 19% are Laotian, and 6% are other ethnicities, according to 2020-2024 ACS data (IPUMS).
🚨 What’s important to know:

ICE agents have been targeting people decades after completing their sentences.
“I feel like they’re always forever judged. They can live 20, 30, 40, 50 years as a good person, but then that one crime would just always make them a bad person,” Xiong said, referring to the Hmong deportees. “It doesn’t matter all the good that they do — just that one crime, it’s all made their image who America sees them as.”
— Linda, a Hmong immigrant from Minnesota whose husband was deported to Laos in June 2026
✊ How communities are taking action:
Well before President Trump took office, organizations like SEARAC and SEAFN were mobilizing to protect Hmong, Lao, and other Southeast Asian refugees from detention and deportation. Working with congressional leaders, these organizations helped develop the Southeast Asian Deportation Relief Act (SEADRA) — which aims to end deportation for Southeast Asians as we know it and provide relief to Southeast Asian families from the lasting harm of several 1996 immigration laws.
People from Uzbekistan in OklahomaWhen looking at disproportionality, Uzbekistani arrests stood out in Oklahoma in particular. Just 0.4% of Uzbekistani noncitizens nationwide live in the state, but a staggering 10.1% of Uzbekistani ICE arrests occurred there.
🚨 What’s important to know:
Other Central Asian truck drivers are also getting swept up in ICE raids.
“Trucking can pay up to $2,500 a week and the job is relatively simple, so losing it to such arbitrary rules feels unfair to the Tajiks I know who’re just trying to feed their families back home.”
— Anis, a Tajikistani immigrant and a long-haul trucker in Florida
✊ How communities are taking action:
AAPI legal and civil rights groups — including Asian Law Caucus and the Sikh Coalition — have gone to court on multiple fronts: backing New York’s fight against a federal funding penalty tied to its commercial driver’s license (CDL) program, and directly suing California’s DMV over its handling of non-domiciled license cancellations.
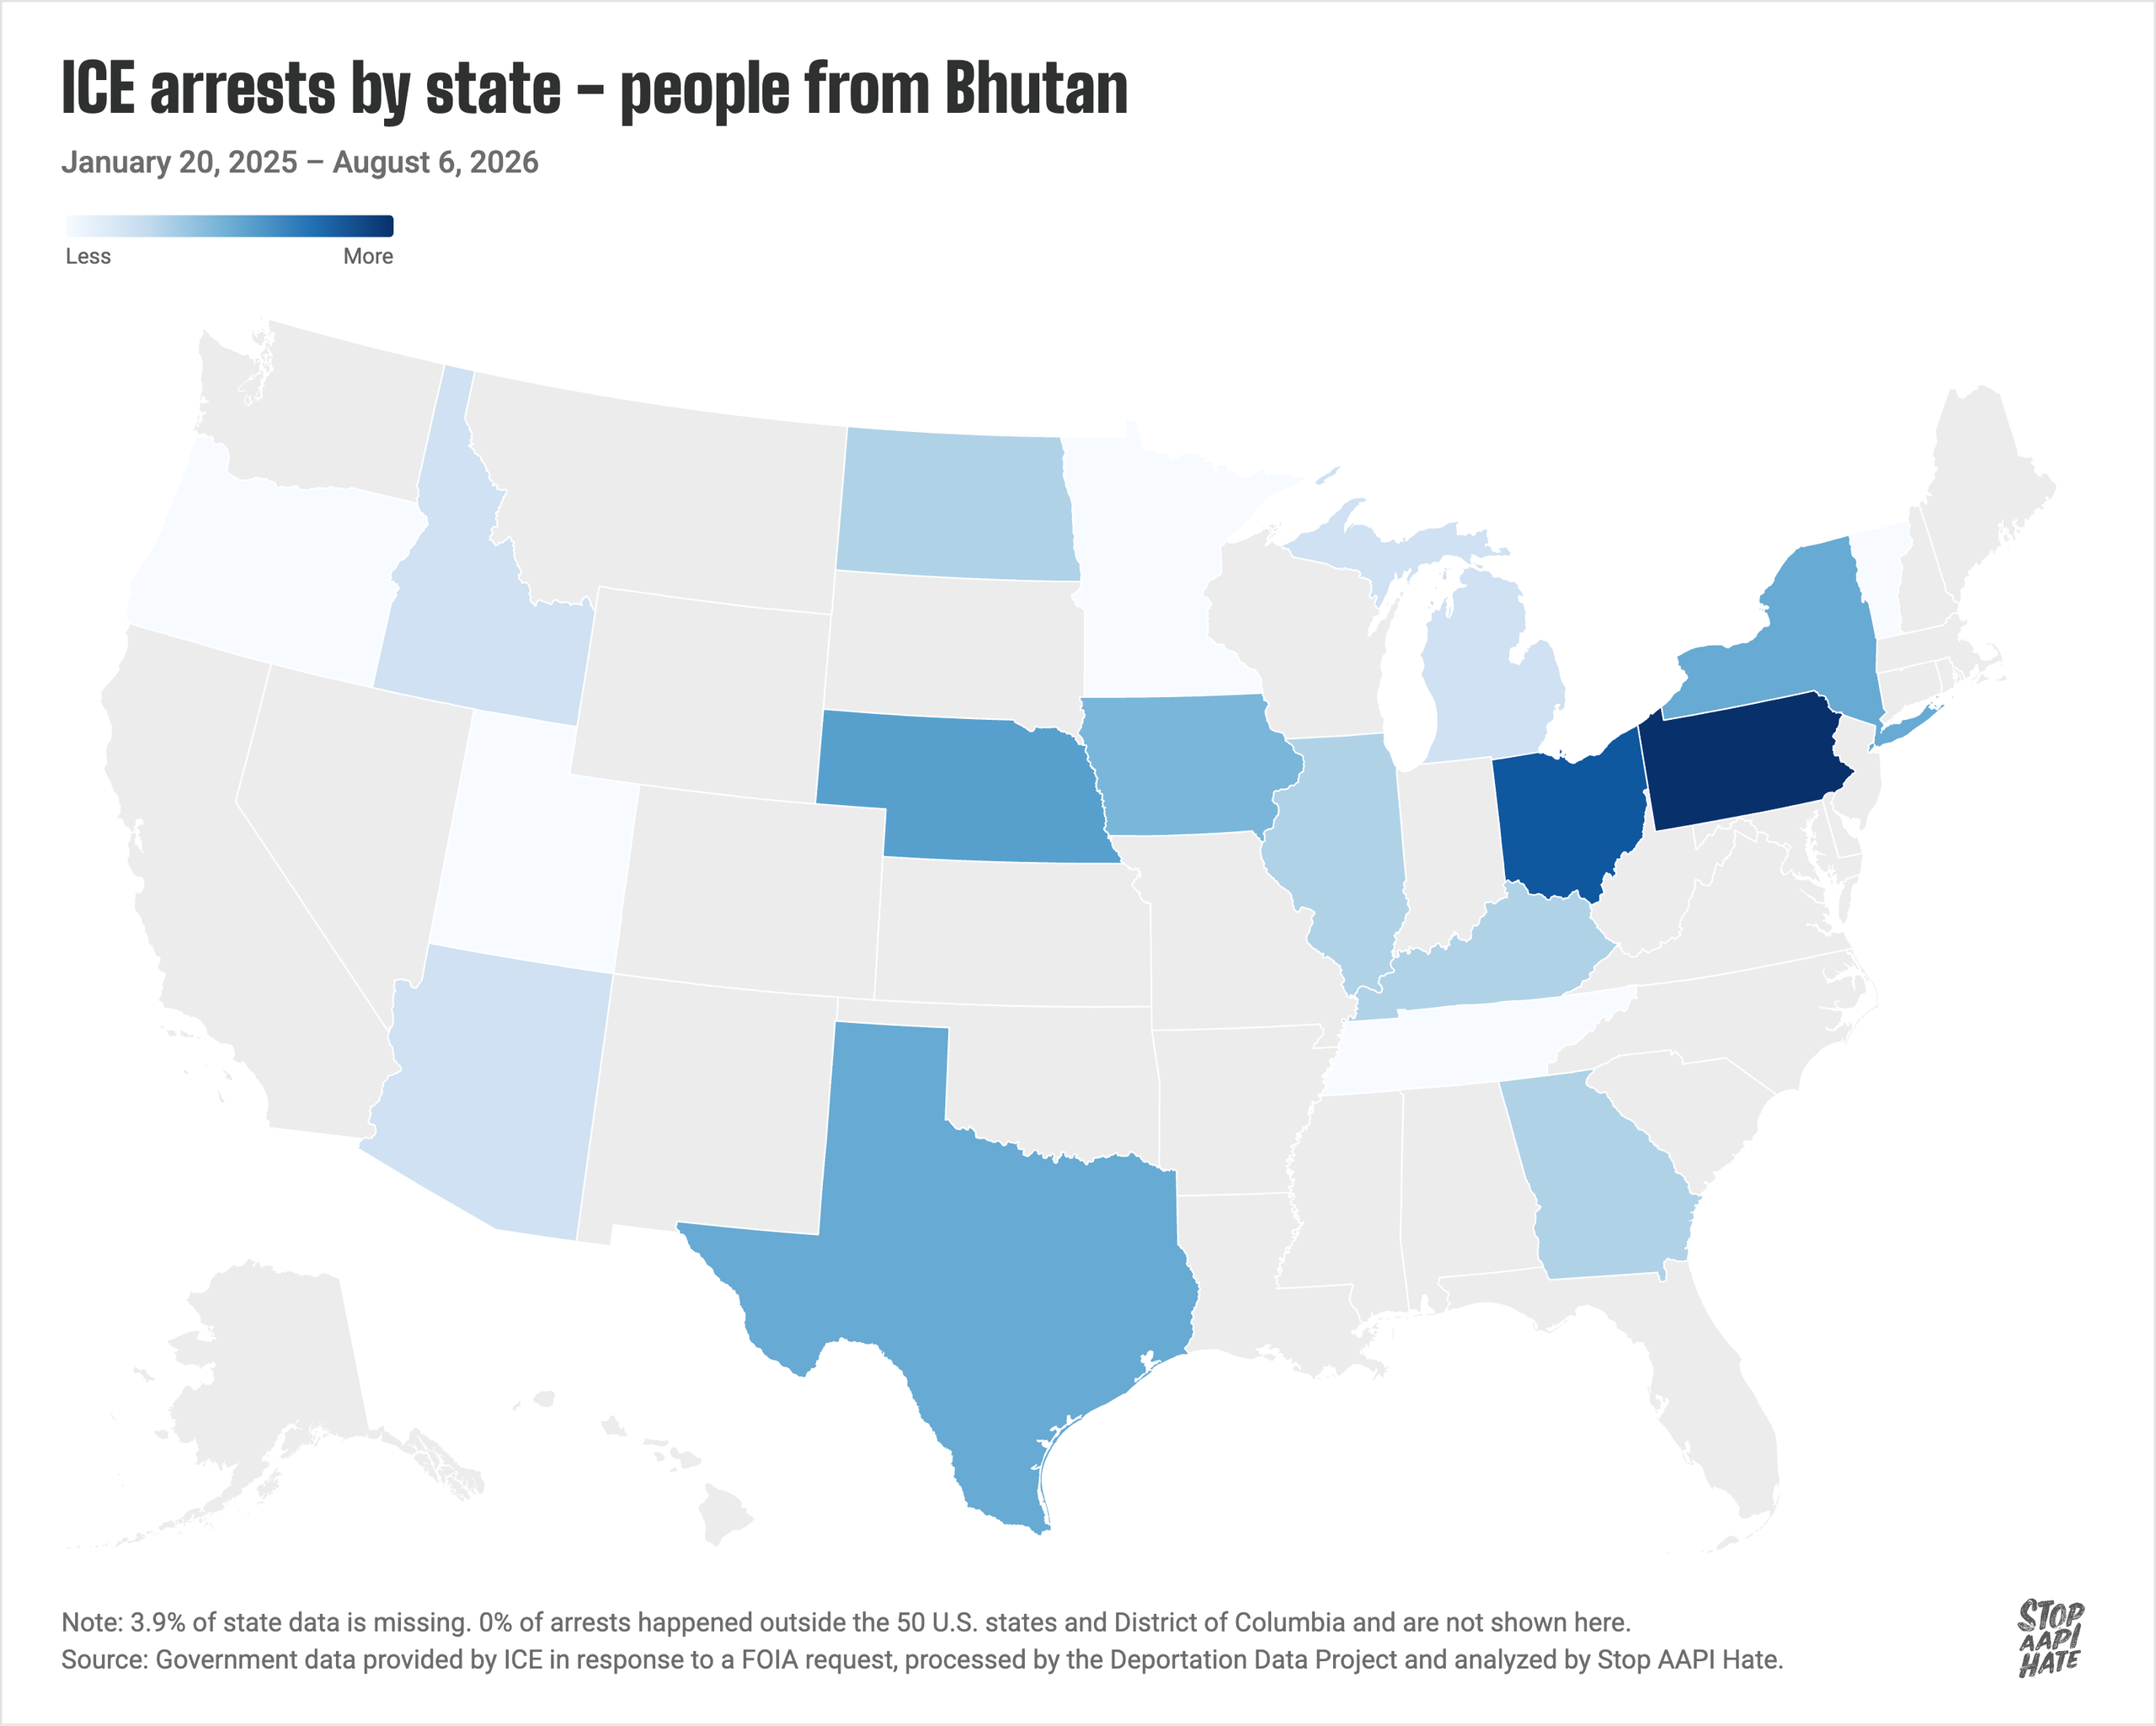
People from Bhutan in PennsylvaniaPeople from Bhutan were also overrepresented in the ICE data. The highest number of these arrests — nearly one-third — has happened in Pennsylvania, which is home to a growing Nepali-speaking Bhutanese population who came to the U.S. as refugees.
🚨 What’s important to know:
Nepali-speaking Bhutanese immigrants fear persecution in Bhutan.
“I was afraid to go back to Bhutan. When I left, people were getting killed everyday. Women were getting raped and beheaded. All of a sudden, they told me I was going back.”
– Don (pseudonym), a Bhutanese immigrant who was deported to Bhutan in December 2025. The Bhutanese government deported him to Nepal within 24 hours.
✊ How communities are taking action:
ARU is one of the organizations fighting on the side of Nepali-speaking Bhutanese people. Their “We Belong Here” campaign directs support to impacted families and mobilizes elected officials against the attacks on Nepali-speaking Bhutanese communities.
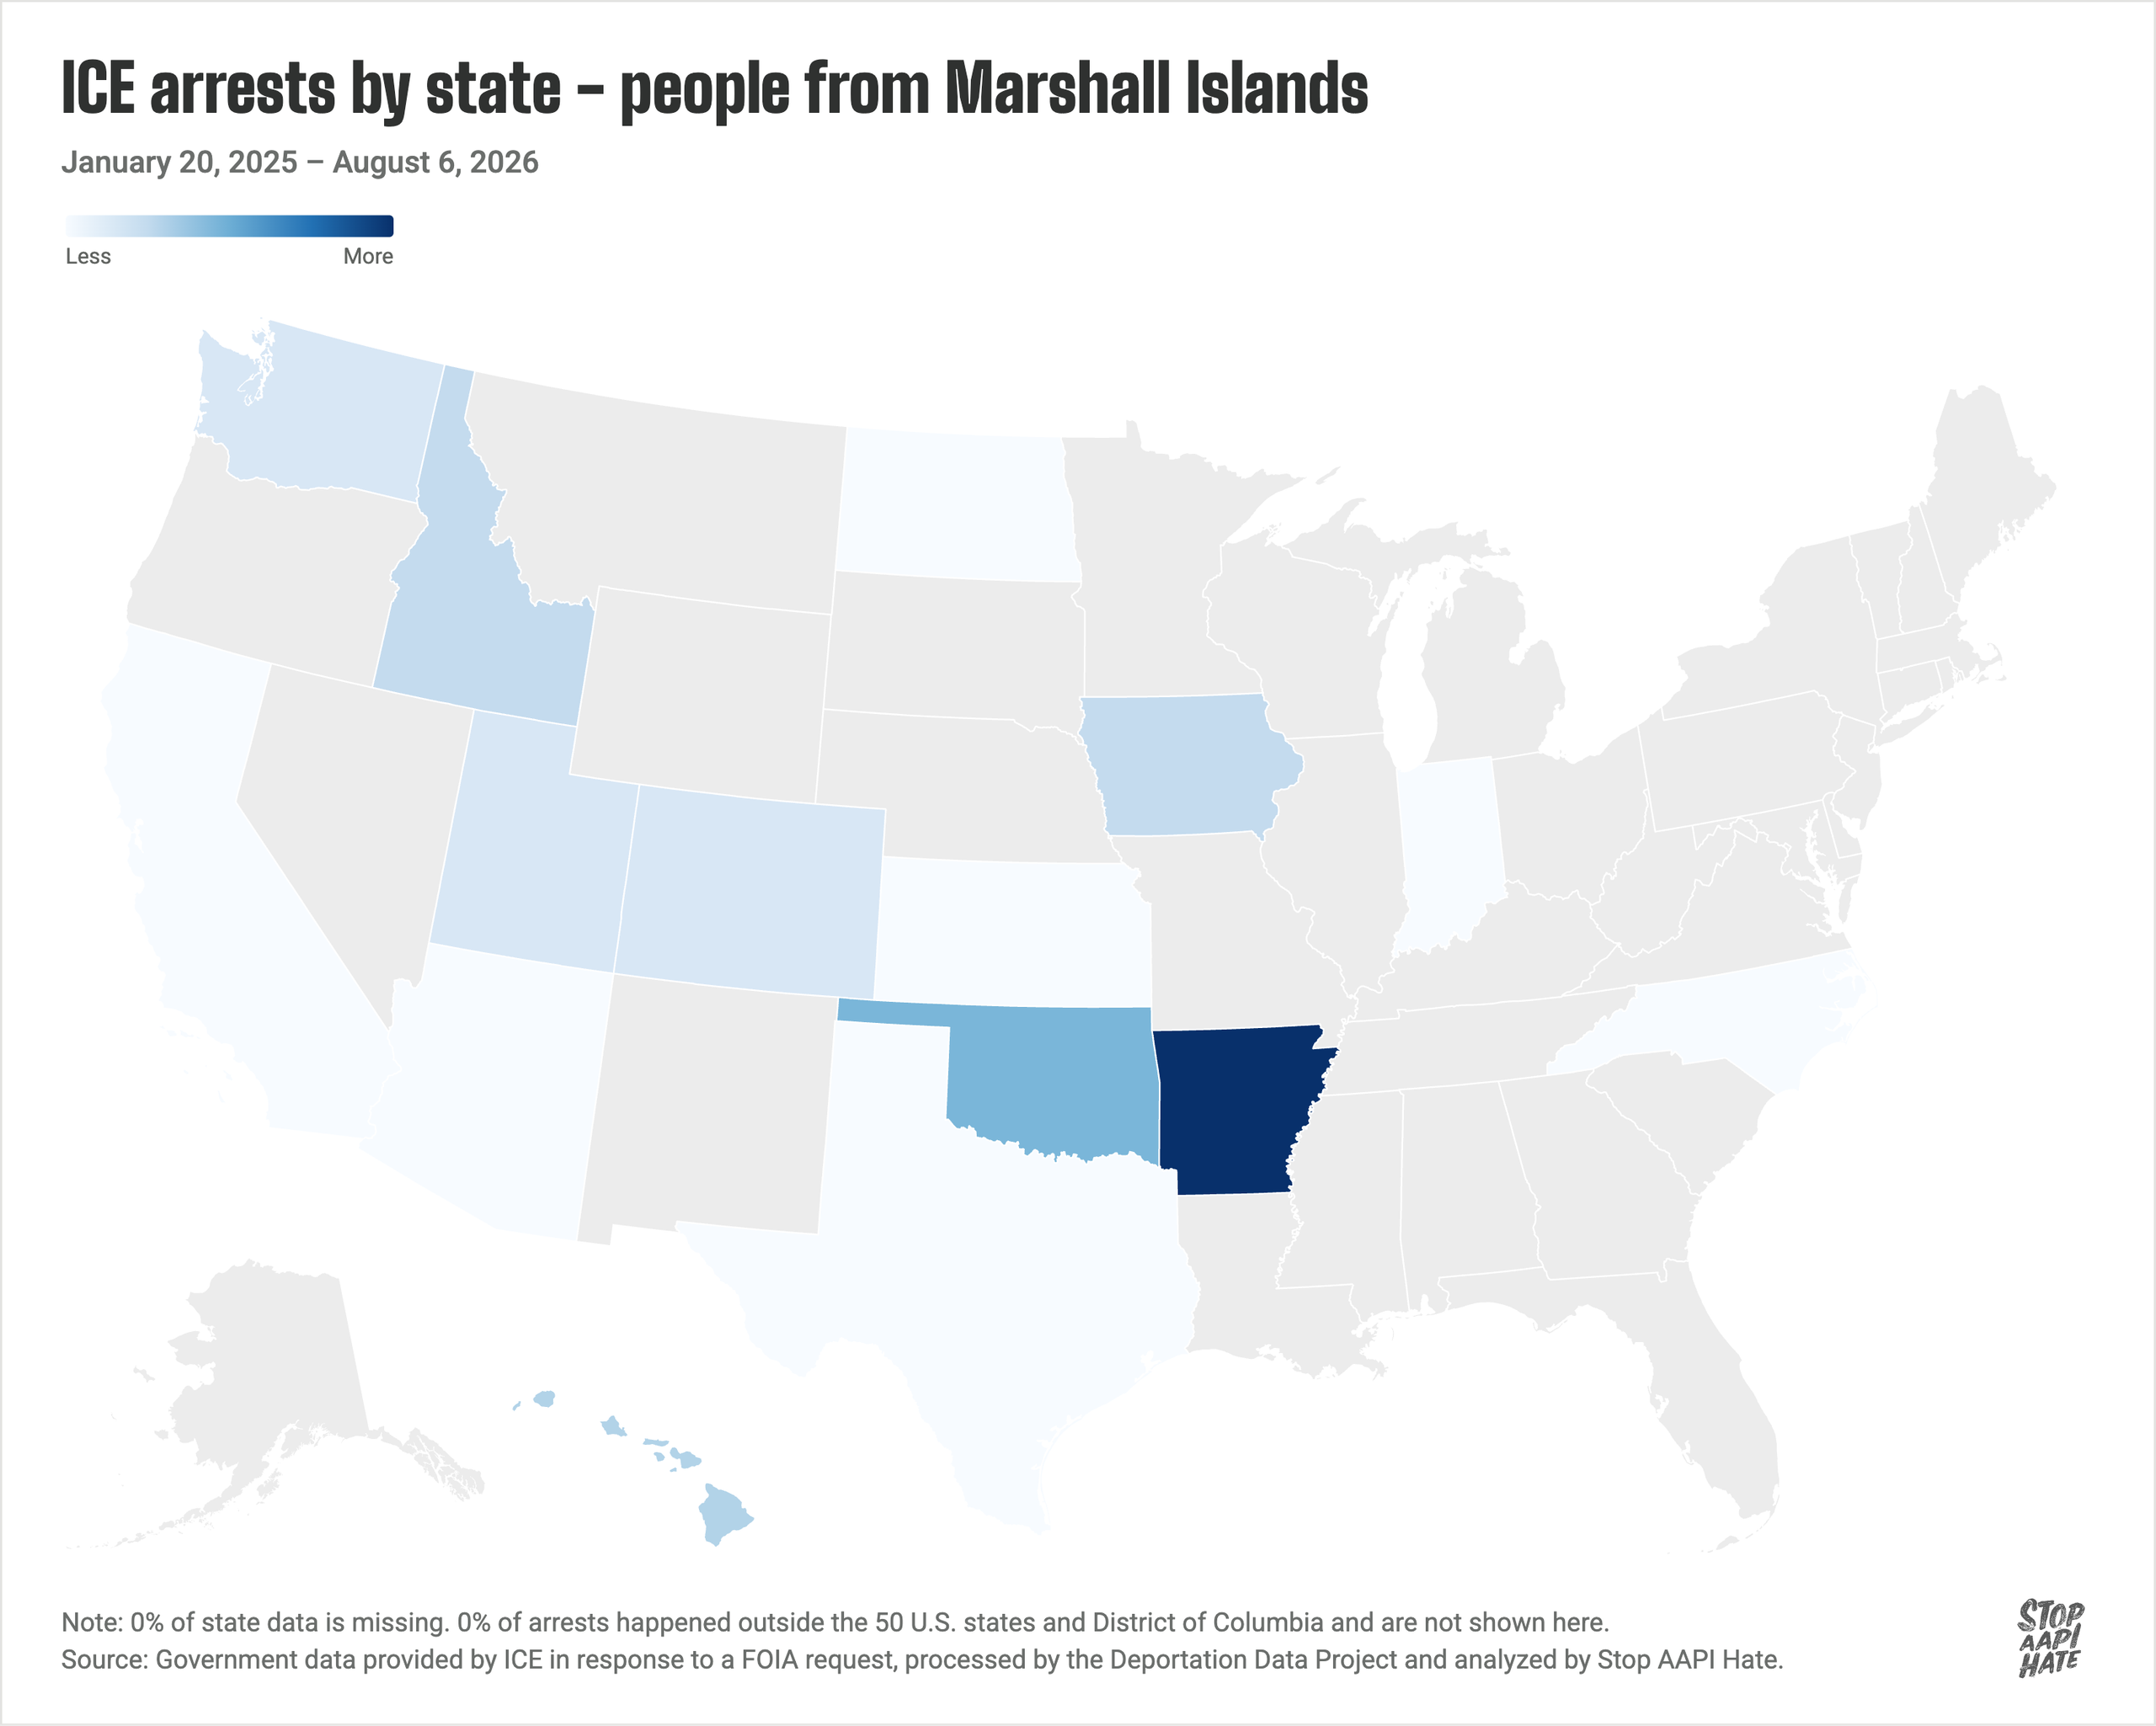
People from the Marshall Islands in ArkansasArkansas is home to the nation’s largest Marshallese community. For decades, Marshallese families have migrated to Northwest Arkansas, drawn by jobs, family networks, and a countryside that reminded them of the Islands. But the size of the community alone doesn’t explain the concentration of ICE activity there. Arkansas is home to 28.3% of Marshallese-born non-U.S. citizens nationwide — but 73.7% of all Marshallese arrests have occurred there, a striking overrepresentation.
🚨 What’s important to know:
With their families back in the U.S., deported Marshallese people struggle to adjust to the Marshall Islands.
“People I grew up with: my siblings, my nieces and nephews, my daughter, my parents, my grandparents, my uncles, my aunties, everybody is [in the U.S.]”
– Jack (pseudonym), a Marshallese person who was deported back to the Islands in 2025
✊ How communities are taking action:
ACOM is closing that gap with interpretation services, court accompaniment, and know-your-rights education. Alliance for Immigrant Respect and Education (AIRE) runs volunteer networks that deliver groceries and send ICE-presence alerts. These efforts show how grassroots mutual aid can push back against the harms of federal immigration enforcement.
Explore what is happening in your communityThe Asian and Pacific Islander ICE Tracker is intended to make immigration enforcement more transparent — and to make visible the harm that A/PI communities continue to endure. Use the tracker to explore what is happening in your community.
Most importantly, remember what the figures cannot show. Behind every arrest, detention, and deportation are people with relationships, responsibilities, hopes, and a reason for making the United States their home.
Thank you to Arkansas Coalition of Marshallese, Asian Refugees United, the Sikh Coalition, Southeast Asia Resource Action Center, and Southeast Asian Freedom Network for contributing to this post by sharing context and insights from the communities they serve.
If you have questions about the data, please reach out to the Stop AAPI Hate Data & Research team.
 A/PI ICE Fact Sheets
These fact sheets highlight key statistics from the Asian and Pacific Islander ICE data to show the impacts of immigration enforcement on our communities.
| # | Наименование новости | Тональность | Информативность | Дата публикации |
|---|---|---|---|---|
| 1 | Asian and Pacific Islander ICE Data | 0 | 6.4 | 15-09-2026 |
| 2 | New ICE Tracker Offers Detailed Look at Rise in Arrests, Detentions, Deportations of Asians & Pacific Islanders | 0 | 6.84 | 15-09-2026 |
| 3 | “I’m Going to Call ICE”: New Report Reveals a Majority of Anti-Asian Hate Acts Include Anti-Immigrant Hostility | 0 | 10.17 | 14-10-2026 |
| 4 | How Trump is Rolling Back Voting Rights and Threatening the AAPI Vote | 0 | 5.06 | 07-08-2026 |
| 5 | The State of Anti-South Asian Hate | 0 | 11.31 | 03-09-2026 |
| 6 | License to Hate | 0 | 10.02 | 14-10-2026 |
| 7 | AAPI Communities Can Change the Course of Congress. | 0 | 7.38 | 13-10-2026 |
| 8 | Together Against Hate | 0 | 8.24 | 31-07-2026 |
| 9 | Internationalist Solidarity with migrants in the United States | 0 | 5.29 | 01-04-2026 |
| 10 | Stop AAPI Hate Raises Alarm on Anti-South Asian Hate After Chicago Man Is Arrested for Attempted Mass Shooting at Hindu Temple | 0 | 5.31 | 15-10-2026 |