Просмотр новости
Найдите то, что Вас интересует
 Спутники
 РН
РН SpaceX
 Роскосмос
 NASA
NASA
СпутникиРНSpaceXРоскосмосNASAStuck in CrashLoopBackOff or Pending pods? This Kubernetes troubleshooting guide helps you diagnose faster and fix the most common errors.
Ops teams spend over 60% of their time managing Kubernetes on troubleshooting. Not building new services or improving infrastructure, but figuring out what went wrong.
If this sounds familiar, you’re definitely not alone. Kubernetes troubleshooting is one of those things that every team underestimates until they’re staring at a CrashLoopBackOff at 2 a.m., wondering where to even start looking.
The good news, however, is that Kubernetes issues follow predictable patterns. Once you understand how Kubernetes works under the hood and where things typically break, troubleshooting becomes far less reactive and a lot more structured.
This guide covers the most common Kubernetes errors, a practical troubleshooting workflow, and the best practices that help teams resolve issues faster.
Kubernetes troubleshooting is the process of identifying, diagnosing, and resolving issues across your clusters, nodes, pods, and containers. But in practice, it’s less about fixing isolated errors and more about interpreting signals across multiple layers of your environment.
When something goes wrong in Kubernetes, the root cause is rarely where the symptom shows up. A pod stuck in Pending, for example, might appear to be an application issue but actually trace back to insufficient node resources or a misconfigured node selector. A service returning 503s could have nothing to do with the service itself and everything to do with a mismatched label selector between the Service and its target Pods.
This is also what differentiates Kubernetes troubleshooting from traditional infrastructure debugging. You aren’t diagnosing a single server or following a linear path from error to fix. Instead, you’re navigating across workloads, configurations, networking layers, and resource allocations that all interact with each other, often in ways that aren’t immediately obvious.
The teams that troubleshoot effectively aren’t just the ones who know the right kubectl commands. They’re the ones who understand where to look first and why.
Three Pillars of Effective Kubernetes TroubleshootingEffective Kubernetes troubleshooting comes down to three core disciplines: understanding the problem, managing the resolution, and preventing it from happening again. When applied consistently, these turn reactive firefighting into a repeatable process.
1. UnderstandBefore you can fix anything, you need to understand what’s actually happening. That means identifying both the symptom and the underlying cause. In practice, this usually involves:
Once you understand what’s causing the issue, remediation should be deliberate. That means applying targeted fixes based on what the diagnostics are actually telling you: adjusting resource limits, correcting a misconfigured probe, rolling back a deployment, or fixing a YAML error.
But how you get there depends on your team’s maturity and the level of documentation in your response processes.
Regardless of the approach you use, the goal is the same: precision over guesswork.
3. PreventThis is probably the most overlooked pillar. After resolving an incident, the best teams ask: how do we make sure this doesn’t happen again?
That could mean:
Beyond the specific fix, this is also the right time to evaluate whether your current monitoring, alerting, and access controls are actually surfacing problems early enough. Prevention is what turns individual fixes into lasting operational improvements.
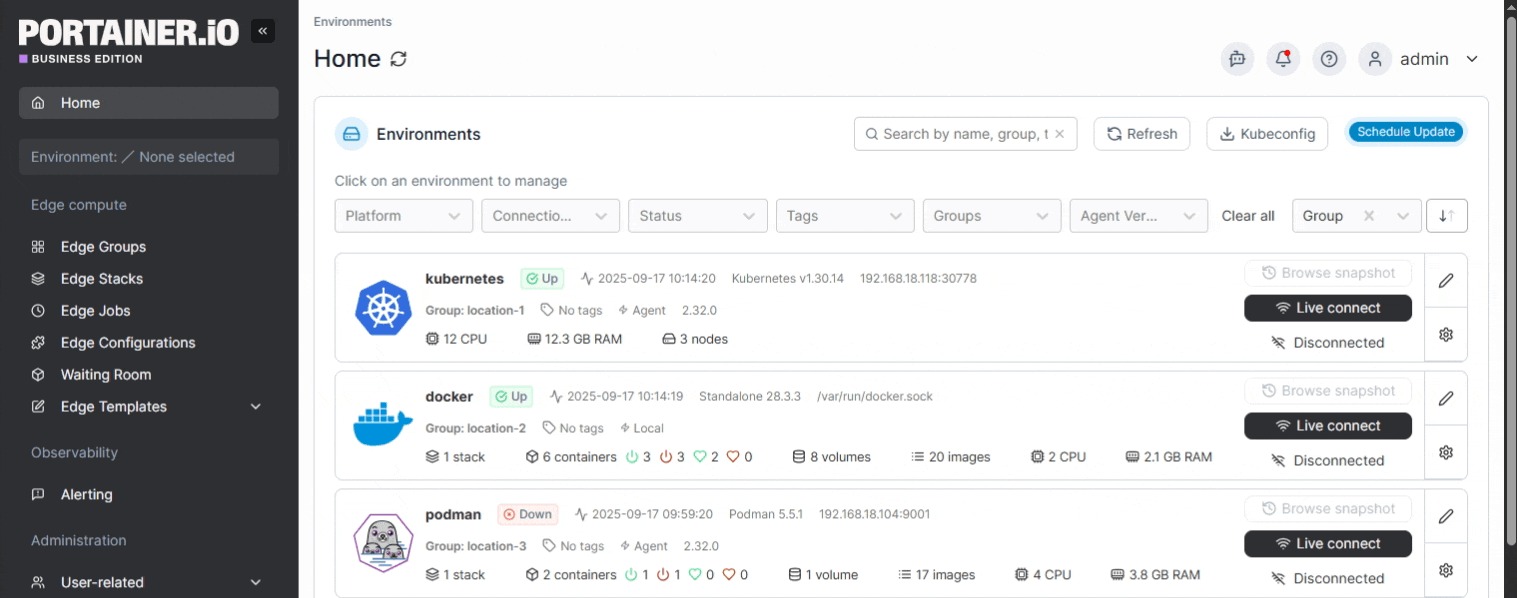
By design, Kubernetes is complex, and troubleshooting it is no exception. Here are some systemic reasons that even experienced teams find it challenging to troubleshoot:
{{article-cta}}
A Practical Kubernetes Troubleshooting WorkflowIf you’re dealing with a Kubernetes issue and aren’t sure where to start, here’s a step-by-step workflow to help you quickly narrow the problem space.
Step 1: Determine the ScopeStart by asking: Is this affecting one pod, one node, one namespace, or the entire cluster? The answer here will shape everything that follows.
A single crashing pod is a very different investigation from a cluster-wide scheduling failure. Run kubectl get pods -A to get a broad view, then run kubectl get nodes to check whether the issue is correlated with a specific node.
If multiple unrelated workloads are failing at the same time, that’s usually a signal to skip ahead to cluster-level health (Step 5) rather than investigating individual pods.
Step 2: Check Workload StateOnce you’ve scoped the issue, look at what Kubernetes is telling you about the affected workloads. Run kubectl describe pod <pod-name> and focus on the Status, Conditions, and Events sections.
The status itself narrows your next move. A pod stuck in Pending tells you to investigate scheduling and resources. A pod in CrashLoopBackOff tells you to investigate the application or its configuration. A pod showing Terminating for an unusually long time might indicate a stuck finalizer or a process that isn’t responding to SIGTERM.
The goal here isn’t to fix anything yet, but to categorize the problem so you’re looking in the right place.
Step 3: Validate ConfigurationA surprising number of Kubernetes issues stem from a mismatch between what was intended and what was actually applied. This step is about checking whether the deployed configuration matches expectations:
Configuration drift between staging and production is one of the most common and hardest-to-spot causes of production failures. This is also why Kubernetes governance practices are so important.
Step 4: Inspect Logs and EventsIf the workload state and configuration both look correct, go deeper into Kubernetes logs and cluster events.
Correlating both gives you the full picture. For example, a pod might show no obvious errors in its logs, but Kubernetes events reveal that its readiness probe has been failing intermittently, causing it to be removed from Service endpoints without actually crashing.
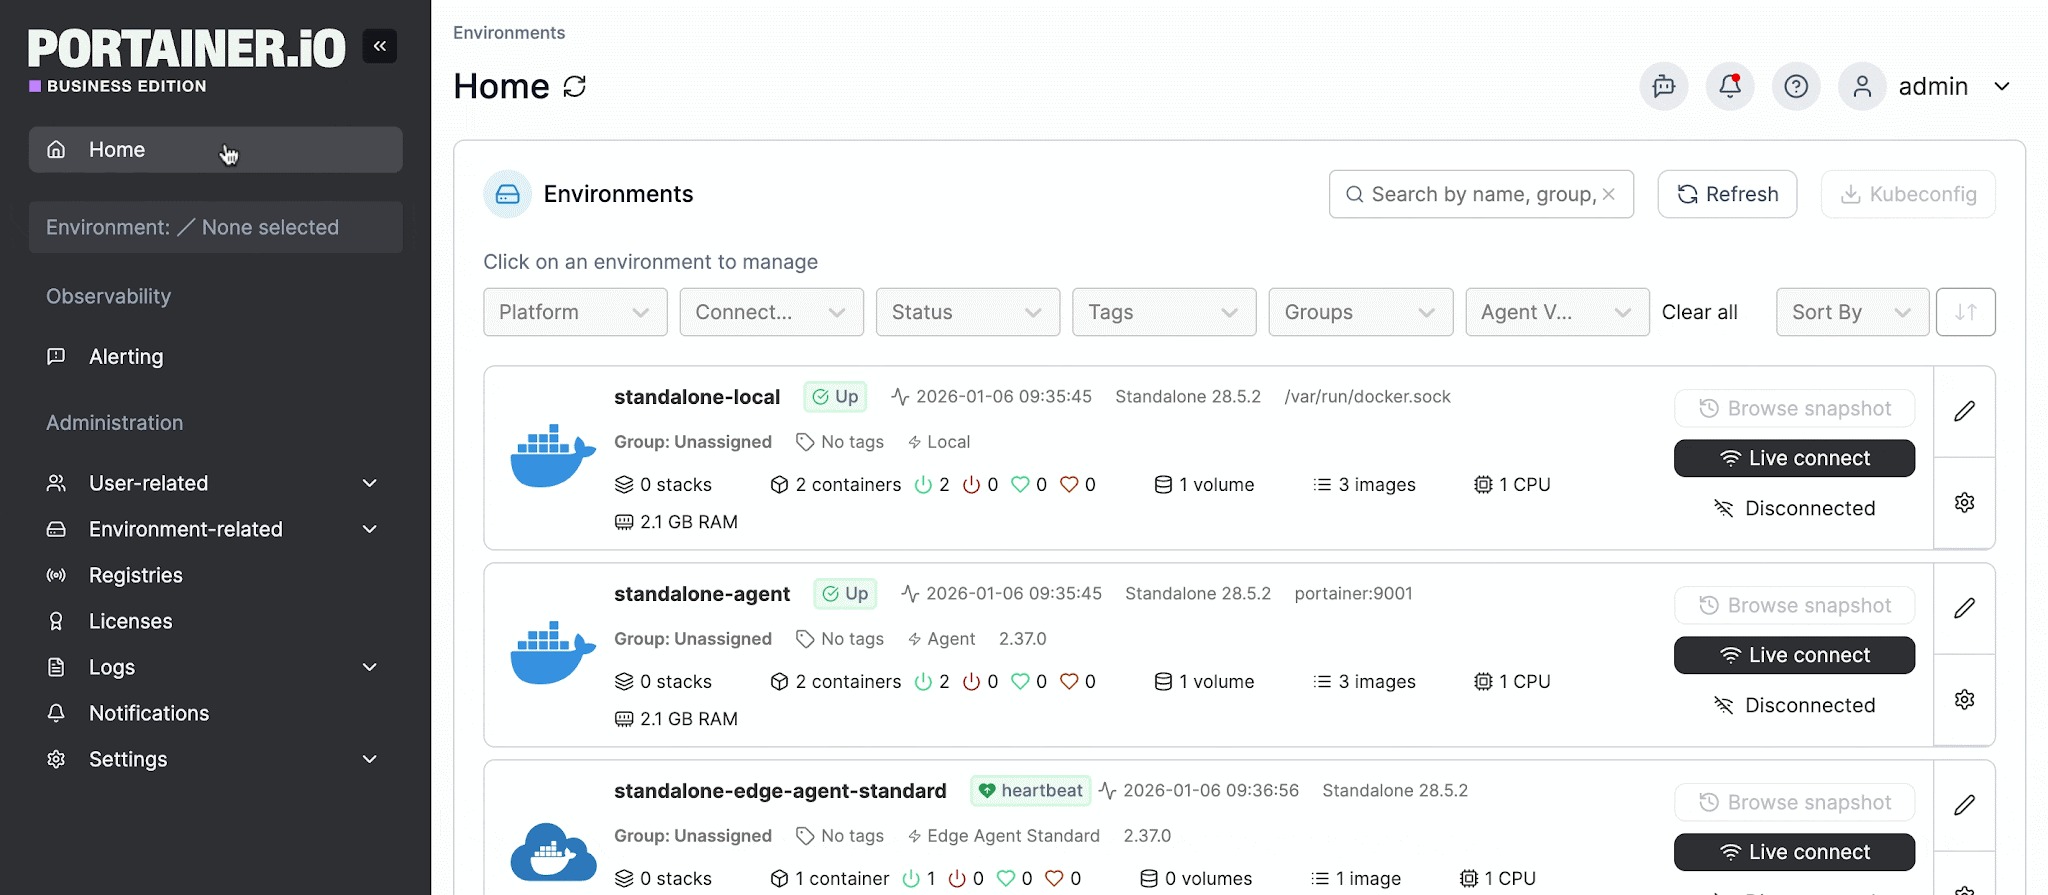
If the issue isn’t isolated to a specific workload or configuration, zoom out.
Node-level problems, resource exhaustion, or control plane issues can cause symptoms that look application-level but are actually infrastructure-level.
Check node conditions with kubectl describe node <node-name> and look for pressure indicators: MemoryPressure, DiskPressure, or PIDPressure.
And review cluster-wide resource utilization with kubectl top nodes and kubectl top pods to identify whether the cluster is overcommitted.
For teams managing multiple clusters, a centralized Kubernetes monitoring setup provides visibility across environments, making this step significantly faster than switching between individual cluster contexts.
This is also where platforms like Portainer add real value, giving ops teams a single view across clusters, nodes, and workloads so that cluster-level patterns are visible immediately rather than requiring manual CLI investigation across each environment.
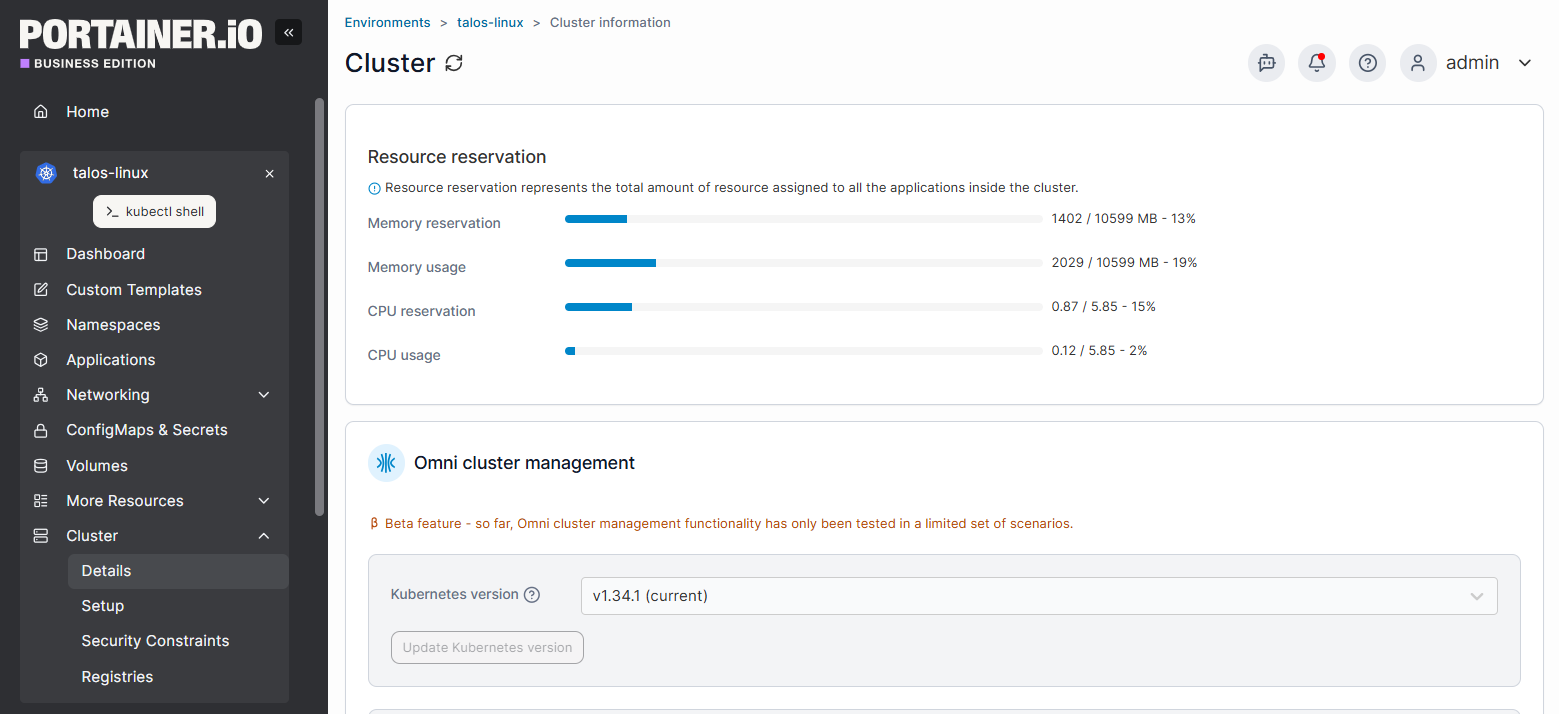
Not every Kubernetes error requires deep investigation, but most require knowing what you’re actually looking at.
Here are the error patterns ops and platform teams encounter, what they typically point to, and where to focus your attention.
| Error | What It Means | Most Common Cause |
|---|---|---|
| CrashLoopBackOff | Container keeps crashing, Kubernetes keeps restarting it | Application error, misconfigured entrypoint, or resource limits exceeded |
| ImagePullBackOff | Kubernetes can’t pull the container image | Image name typo, missing tag, or missing registry credentials |
| OOMKilled | Container terminated for exceeding memory limit | Memory limit too low, memory leak, or node overcommitment |
| CreateContainerConfigError | Container can’t start due to missing reference | Missing or renamed ConfigMap, Secret, or key |
| Pod Stuck in Pending | Pod accepted but can’t be scheduled | Insufficient node resources, restrictive affinity rules, or unbound PVC |
| Node NotReady | Kubelet stopped communicating with control plane | Node resource exhaustion, network issues, or failed kubelet |
| Probe Failures | Liveness or readiness checks failing | Wrong port/path, insufficient startup delay, or unhealthy app |
| RBAC Forbidden | API server denying a request | Missing or misconfigured Role/ClusterRoleBinding |
This is one of the most common Kubernetes errors you’ll encounter. Here, your container keeps crashing, and Kubernetes keeps restarting it with increasing delays between attempts. CrashLoopBackOff itself isn’t the problem, though; it’s a symptom telling you something deeper is failing.
What causes it: Application bugs, misconfigured entrypoints, missing dependencies, or resource limits being exceeded. Start with kubectl logs <pod-name> --previous to see what happened in the last crash. This is usually the fastest path to the actual problem.
2. ImagePullBackOff / ErrImagePullKubernetes can’t pull the container image from the registry. You’ll see ErrImagePull on the first attempt, then ImagePullBackOff as Kubernetes retries with increasing delays.
What causes it: A typo in the image name or tag (more often than people would like to admit), the image not existing in the specified registry, or missing imagePullSecrets for a private registry. The Events section in kubectl describe pod will tell you exactly which pull failed and why.
3. OOMKilledThe container was terminated because it exceeded its memory limit. You’ll see exit code 137 and Reason: OOMKilled in the pod description.
What causes it: Memory limits set too low for the application’s actual needs. This happens often when teams copy resource specs from templates without adjusting them to the specific workload. It can also indicate a memory leak or node-level overcommitment. Compare actual usage against configured limits with kubectl top pod to narrow it down.
4. CreateContainerConfigErrorThe container can’t even start. Something it needs to reference doesn’t exist.
What causes it: A missing or renamed ConfigMap, Secret, or key is almost always the issue. Maybe someone renamed a Secret in one namespace but not another, or there’s a typo in a volume mount path. kubectl describe pod will tell you exactly which resource is missing.
5. Pod Stuck in PendingThe pod has been accepted by the cluster but hasn’t been scheduled to a node. It’s just sitting there, waiting.
What causes it: Insufficient CPU or memory on available nodes are probable reasons for this. But it could also be overly restrictive node selectors or affinity rules, or a PersistentVolume that can’t be bound. If you’re seeing this across multiple pods, it’s usually a sign the cluster needs more capacity rather than a configuration fix.
6. Node NotReadyA node is showing NotReady status, which means the kubelet on that node has stopped communicating with the control plane. This one can be stressful because it potentially affects every workload running on that node.
What causes it: This is frequently caused by node resource exhaustion (disk, memory, or PIDs). Network connectivity issues or a crashed kubelet process can also trigger it. Check kubectl describe node for specific pressure conditions, then investigate kubelet logs on the node itself.
7. Readiness and Liveness Probe FailuresThese two get confused a lot, but they do very different things. A failing liveness probe causes Kubernetes to restart the pod. A failing readiness probe removes the pod from Kubernetes service endpoints, causing it to stop receiving traffic but keep running.
What causes it: Probes pointing to the wrong port or path, or initialDelaySeconds set too short for the application’s actual startup time. Misconfigured probes are among the frequent sources of unexpected pod restarts and intermittent traffic drops, and they can be tricky to spot because the pod itself might appear healthy from the outside.
8. RBAC Permission Errors (Forbidden)A user, service account, or workload gets a 403 Forbidden response from the API server. In plain terms, Kubernetes RBAC is saying, “You don’t have permission to do that.”
What causes it: Missing or misconfigured Role/ClusterRoleBindings. This often happens after role changes, when a new service account hasn’t been granted the right bindings, or when namespace-scoped roles are applied but the request targets a cluster-scoped resource. The error message usually specifies the exact verb and resource being denied, which tells you precisely where to look.
{{article-cta}}
Best Practices for Effective Kubernetes TroubleshootingThe workflow and error patterns covered above will help you resolve issues faster in the moment. But the teams that spend the least time troubleshooting are the ones that invest in making it easier before something breaks.
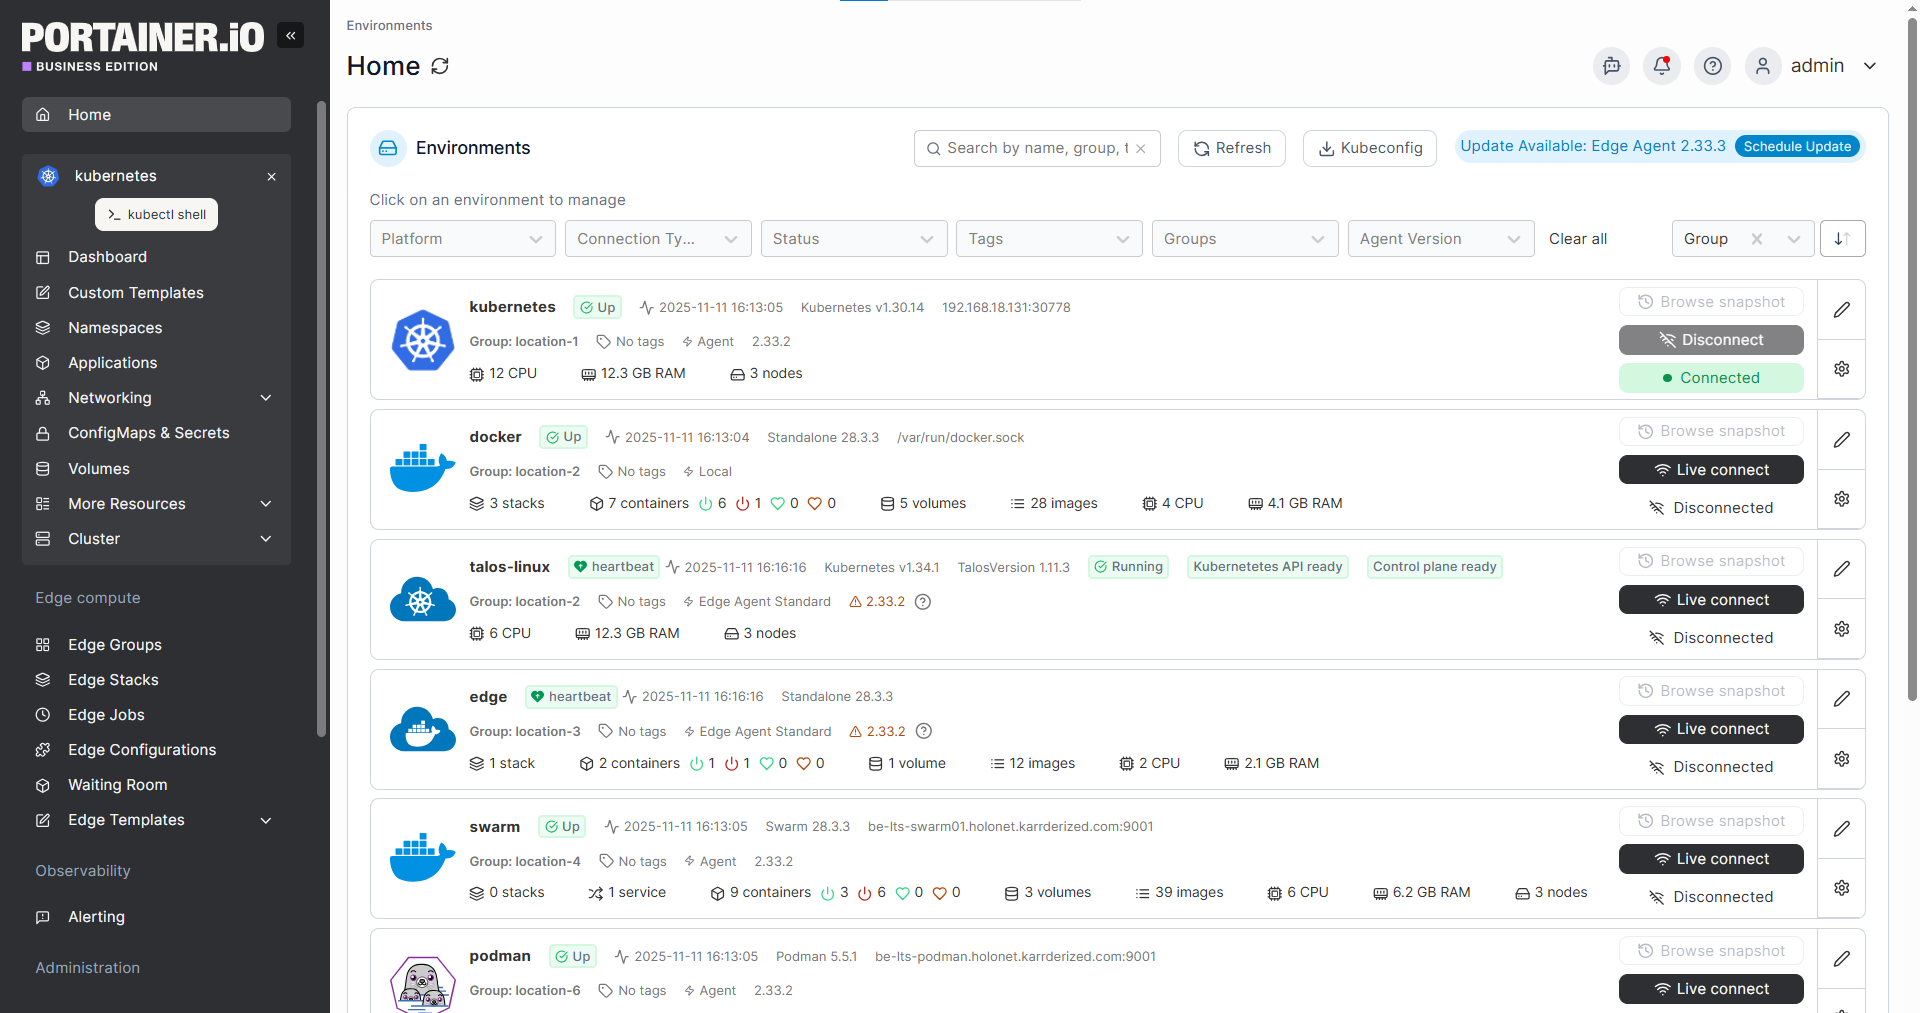
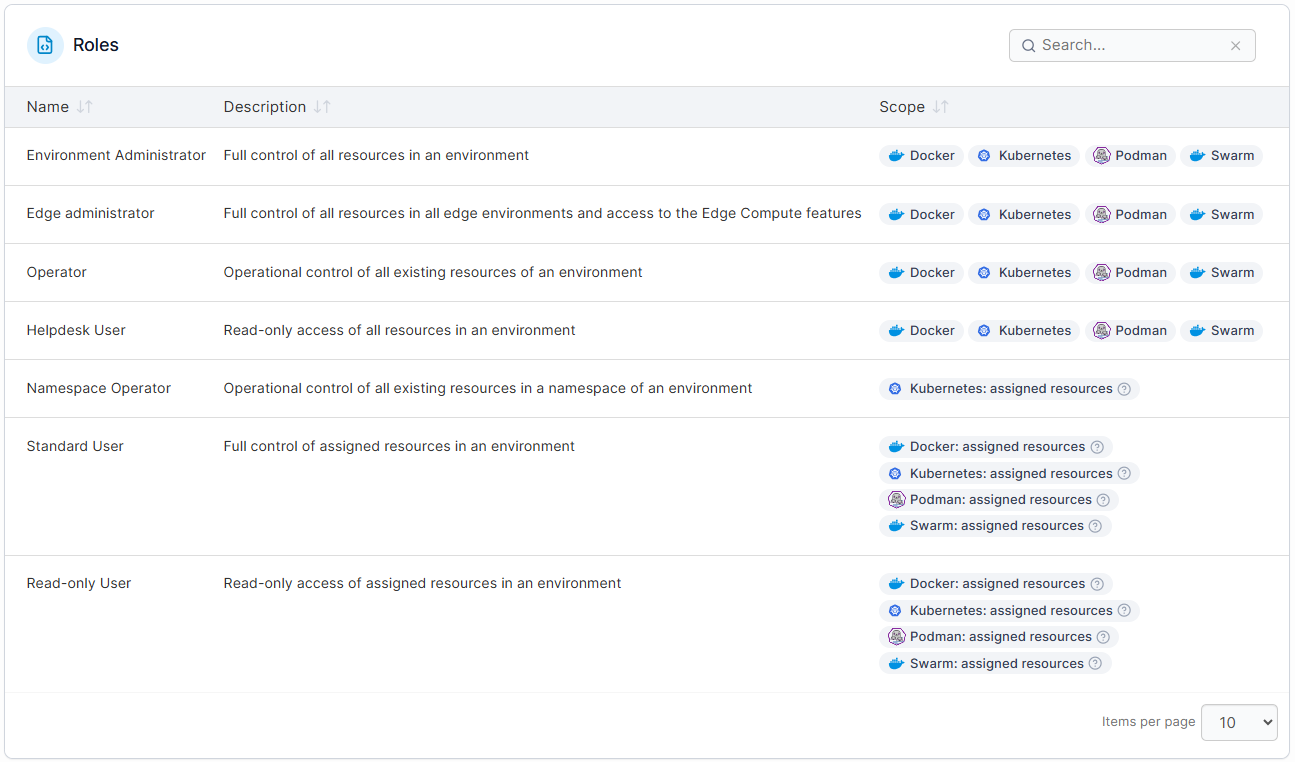
Kubernetes troubleshooting problems tend to share a common thread: too many tools, too many layers, and not enough visibility across all of them.
The teams that resolve issues fastest and stay ahead of the next one are those with centralized visibility, consistent policies, and clear access controls across all clusters and environments.
Portainer is a lightweight, self-hosted, vendor-agnostic container management platform that gives ops and platform engineering teams a single interface for Kubernetes, Docker, and Podman. It also provides multi-cluster visibility, built-in RBAC, GitOps integration, and governance controls without the complexity or cost typically associated with full-scale enterprise platforms.
For teams that don’t need the operational overhead of an OpenShift or Rancher deployment, Portainer offers the same core visibility and governance capabilities in a lighter footprint
If your team is spending more time troubleshooting than building, schedule a demo to see how Portainer gives your team centralized control across every environment.
| # | Наименование новости | Тональность | Информативность | Дата публикации |
|---|---|---|---|---|
| 1 | 2026 Kubernetes Deployment Guide: How to, Solutions & More | 5 | 8 | 03-05-2026 |
| 2 | 2026 Kubernetes Monitoring Guide: Challenges & Best Practices | 0 | 7 | 06-03-2026 |
| 3 | Kubernetes RBAC: Roles, Permissions & Best Practices (2026) | 5 | 8 | 16-02-2026 |
| 4 | 2026 Kubernetes Observability Guide: Pillars, Tools & Tips | 0 | 7 | 24-05-2026 |
| 5 | Kubernetes Lifecycle Management: Challenges & Solutions | 0 | 7 | 16-03-2026 |
| 6 | 7 Best Kubernetes Deployment Tools in 2026: In-Depth Review | 5 | 7 | 02-05-2026 |
| 7 | Kubernetes Support: Services, Tiers & What Enterprises Need | 0 | 7 | 16-03-2026 |
| 8 | Before you scale Kubernetes, check your foundations. | 0 | 7 | 29-04-2026 |
| 9 | 5 Best Kubernetes Security Tools in 2026: Full Breakdown | 0 | 5 | 06-05-2026 |
| 10 | Kubernetes Fleet Management: Your 2026 Optimization Guide | 0 | 5 | 12-04-2026 |