Просмотр новости
Найдите то, что Вас интересует
 Спутники
 РН
РН SpaceX
 Роскосмос
 NASA
NASA
СпутникиРНSpaceXРоскосмосNASAXRP bulls are trying to turn a brutal selloff into something bigger than a relief bounce. An interesting setup shows a possible three-part impulse from the recent low around $1.05, but the entire setup still depends on whether buyers can force the price through the levels that broke during the crash. XRP’s Chart Is Trying To Build A Three-Part Impulse An interesting technical analysis of the XRP price is centered on a possible three-leg recovery structure, with the cryptocurrency’s latest low around $1.07 acting as the starting point. From there, the projected path shows an impulsive move into the $1.94 region, a pullback into the $1.46 zone, and then a much larger advance into the upper resistance band between $2.39 and $3.11. Related Reading: XRP Is Oversold On Every Time Frame, And This Could Be The Bullish Signal Everyone Is Waiting For The interesting chart, which was shared on X by RWA_Investor, shows a macro corrective sequence playing out from XRP’s highs above $3 since last year, a classic W-X-Y double zigzag that has consumed months of price history. The first leg, Wave W, completed a full ABC decline, bottoming at a major low labeled (C)/(W) on the chart in early February. A linking wave X then produced a counter-rally that pushed the XRP price above $1.50 in the middle of May with an internal structure of its own (X)-(A)-(B) sequence before rolling over. That rollover initiated the final Y leg, which has now pushed the XRP price down to the $1.12 range again at the time of writing. The Impulse Setup Back Above $3 Now that the (C)/(Y) wave is playing out at current lows around $1.12, the setup is an anticipated change from correction to a bullish impulse wave. Related Reading: The XRP Dream Has Changed: Why A Rally To $10 Could Happen Despite Disappointment The projected move is a three-wave ABC recovery that targets a destination box between $2.39 and $3.11. Wave A is expected to push toward the $2.12 level; however, this projection does not give XRP a free pass. There’s a support/resistance trendline around $1.46, which is going to be the first test, and there’s another possible rejection test around $2.12. Wave B would then retrace back to around $1.46, but this shakeout should not be mistaken for bearishness. Wave C, the final and strongest leg of the sequence, is going to be characterized by a move into a target zone anywhere between $2.70 and $3.10. A break above $3.10 would suggest that XRP has already found its macro bottom at $1.05. In that scenario, the three-part structure would begin to look like the beginning of a broader trend reversal into new all-time highs. If XRP fails below the upper band and loses momentum after the projected rebound, then it could eventually revisit the $0.75 to $1 range to complete a corrective macro wave 2. Interestingly, multiple analysts have identified the $0.87 to $0.92 region as a potential bottom target for XRP under a corrective macro wave. Featured image from Freepik, chart from Tradingview.com
XRP bulls are trying to turn a brutal selloff into something bigger than a relief bounce. An interesting setup shows a possible three-part impulse from the recent low around $1.05, but the entire setup still depends on whether buyers can force the price through the levels that broke during the crash.
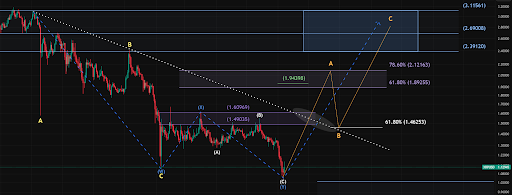
XRP’s Chart Is Trying To Build A Three-Part ImpulseAn interesting technical analysis of the XRP price is centered on a possible three-leg recovery structure, with the cryptocurrency’s latest low around $1.07 acting as the starting point. From there, the projected path shows an impulsive move into the $1.94 region, a pullback into the $1.46 zone, and then a much larger advance into the upper resistance band between $2.39 and $3.11.
The interesting chart, which was shared on X by RWA_Investor, shows a macro corrective sequence playing out from XRP’s highs above $3 since last year, a classic W-X-Y double zigzag that has consumed months of price history. The first leg, Wave W, completed a full ABC decline, bottoming at a major low labeled (C)/(W) on the chart in early February.
 Source: Chart from RWA_Investor on X
A linking wave X then produced a counter-rally that pushed the XRP price above $1.50 in the middle of May with an internal structure of its own (X)-(A)-(B) sequence before rolling over. That rollover initiated the final Y leg, which has now pushed the XRP price down to the $1.12 range again at the time of writing.
The Impulse Setup Back Above $3Now that the (C)/(Y) wave is playing out at current lows around $1.12, the setup is an anticipated change from correction to a bullish impulse wave.
The projected move is a three-wave ABC recovery that targets a destination box between $2.39 and $3.11. Wave A is expected to push toward the $2.12 level; however, this projection does not give XRP a free pass. There’s a support/resistance trendline around $1.46, which is going to be the first test, and there’s another possible rejection test around $2.12.
Wave B would then retrace back to around $1.46, but this shakeout should not be mistaken for bearishness. Wave C, the final and strongest leg of the sequence, is going to be characterized by a move into a target zone anywhere between $2.70 and $3.10.
A break above $3.10 would suggest that XRP has already found its macro bottom at $1.05. In that scenario, the three-part structure would begin to look like the beginning of a broader trend reversal into new all-time highs.
If XRP fails below the upper band and loses momentum after the projected rebound, then it could eventually revisit the $0.75 to $1 range to complete a corrective macro wave 2. Interestingly, multiple analysts have identified the $0.87 to $0.92 region as a potential bottom target for XRP under a corrective macro wave.
Featured image from Freepik, chart from Tradingview.com
| # | Наименование новости | Тональность | Информативность | Дата публикации |
|---|---|---|---|---|
| 1 | XRP Price Next Chapter Could Be A Strong Move To The Upside | 0 | 7.38 | 15-06-2026 |
| 2 | XRP Forms Channel Support That Puts Market In Difficult Spot, But Bulls Still Have A Chance | 0 | 5.68 | 10-06-2026 |
| 3 | XRP Price Troubles Aren’t Over Yet As Downside Risks Mount | 0 | 8.32 | 11-06-2026 |
| 4 | XRP Could Offer Major Buying Opportunity At $0.90, Analyst Says | 0 | 7.94 | 09-06-2026 |
| 5 | XRP’s $1.16 recovery gets support from whales and a $285 million ETF streak | 0 | 13.54 | 23-07-2026 |
| 6 | XRP’s $1.18 breakout line draws a $300 million surge in leveraged bets | 0 | 15.53 | 21-07-2026 |
| 7 | With leverage outnumbering spot volume 6 to 1, XRP traders are walking a $2.36B tightrope | 0 | 14.78 | 07-08-2026 |
| 8 | Crypto Analyst Says Litecoin Is About To Pull An XRP, Here’s What He Means | 0 | 2.81 | 02-12-2024 |
| 9 | Is XRP About to Hit a Level Last Seen in November 2024? | 0 | 12.5 | 13-08-2026 |
| 10 | Ripple-Linked Wallet Moves 50M XRP as Price Tests $1 Support | 0 | 13.59 | 14-08-2026 |