Просмотр новости
Найдите то, что Вас интересует
 Спутники
 РН
РН SpaceX
 Роскосмос
 NASA
NASA
СпутникиРНSpaceXРоскосмосNASABitcoin price started a fresh increase and cleared the $64,500 zone. BTC is consolidating and might aim for more gains above the $66,200 level. Bitcoin managed to stay above $62,500 and started a fresh increase. The price is trading above $64,500 and the 100 hourly simple moving average. There is a bullish trend line forming with support at $64,200 on the hourly chart of the BTC/USD pair (data feed from Kraken). The pair might extend gains if it stays above the $65,500 and $66,200 levels. Bitcoin Price Regains Strength Bitcoin price found support near $60,800 and started a fresh increase. BTC gained pace for a move above the $61,500 and $63,200 resistance levels. The bulls even pushed the price above $64,500. A high was formed at $65,847, and the price started a consolidation phase above the 23.6% Fib retracement level of the upward move from the $60,746 swing low to the $65,847 high. Bitcoin is now trading above $64,500 and the 100 hourly simple moving average. Besides, there is a bullish trend line forming with support at $64,200 on the hourly chart of the BTC/USD pair. If the price remains stable above $64,500, it could attempt a fresh increase. Immediate resistance is near the $65,500 level. The first key resistance is near the $66,200 level. A close above the $66,200 resistance might send the price further higher. In the stated case, the price could rise and test the $66,800 resistance. Any more gains might send the price toward the $67,500 level. The next barrier for the bulls could be $68,000. Another Decline In BTC? If Bitcoin fails to rise above the $66,200 resistance zone, it could start another decline. Immediate support is near the $64,650 level. The first major support is near the $64,200 level. The next support is now near the $63,300 zone or the 50% Fib retracement level of the upward move from the $60,746 swing low to the $65,847 high. Any more losses might send the price toward the $62,500 support in the near term. The main support now sits at $61,800, below which BTC might struggle to recover in the near term. Technical indicators: Hourly MACD – The MACD is now losing pace in the bullish zone. Hourly RSI (Relative Strength Index) – The RSI for BTC/USD is now above the 50 level. Major Support Levels – $64,650, followed by $64,200. Major Resistance Levels – $65,500 and $66,200.
Bitcoin price started a fresh increase and cleared the $64,500 zone. BTC is consolidating and might aim for more gains above the $66,200 level.
Bitcoin price found support near $60,800 and started a fresh increase. BTC gained pace for a move above the $61,500 and $63,200 resistance levels.
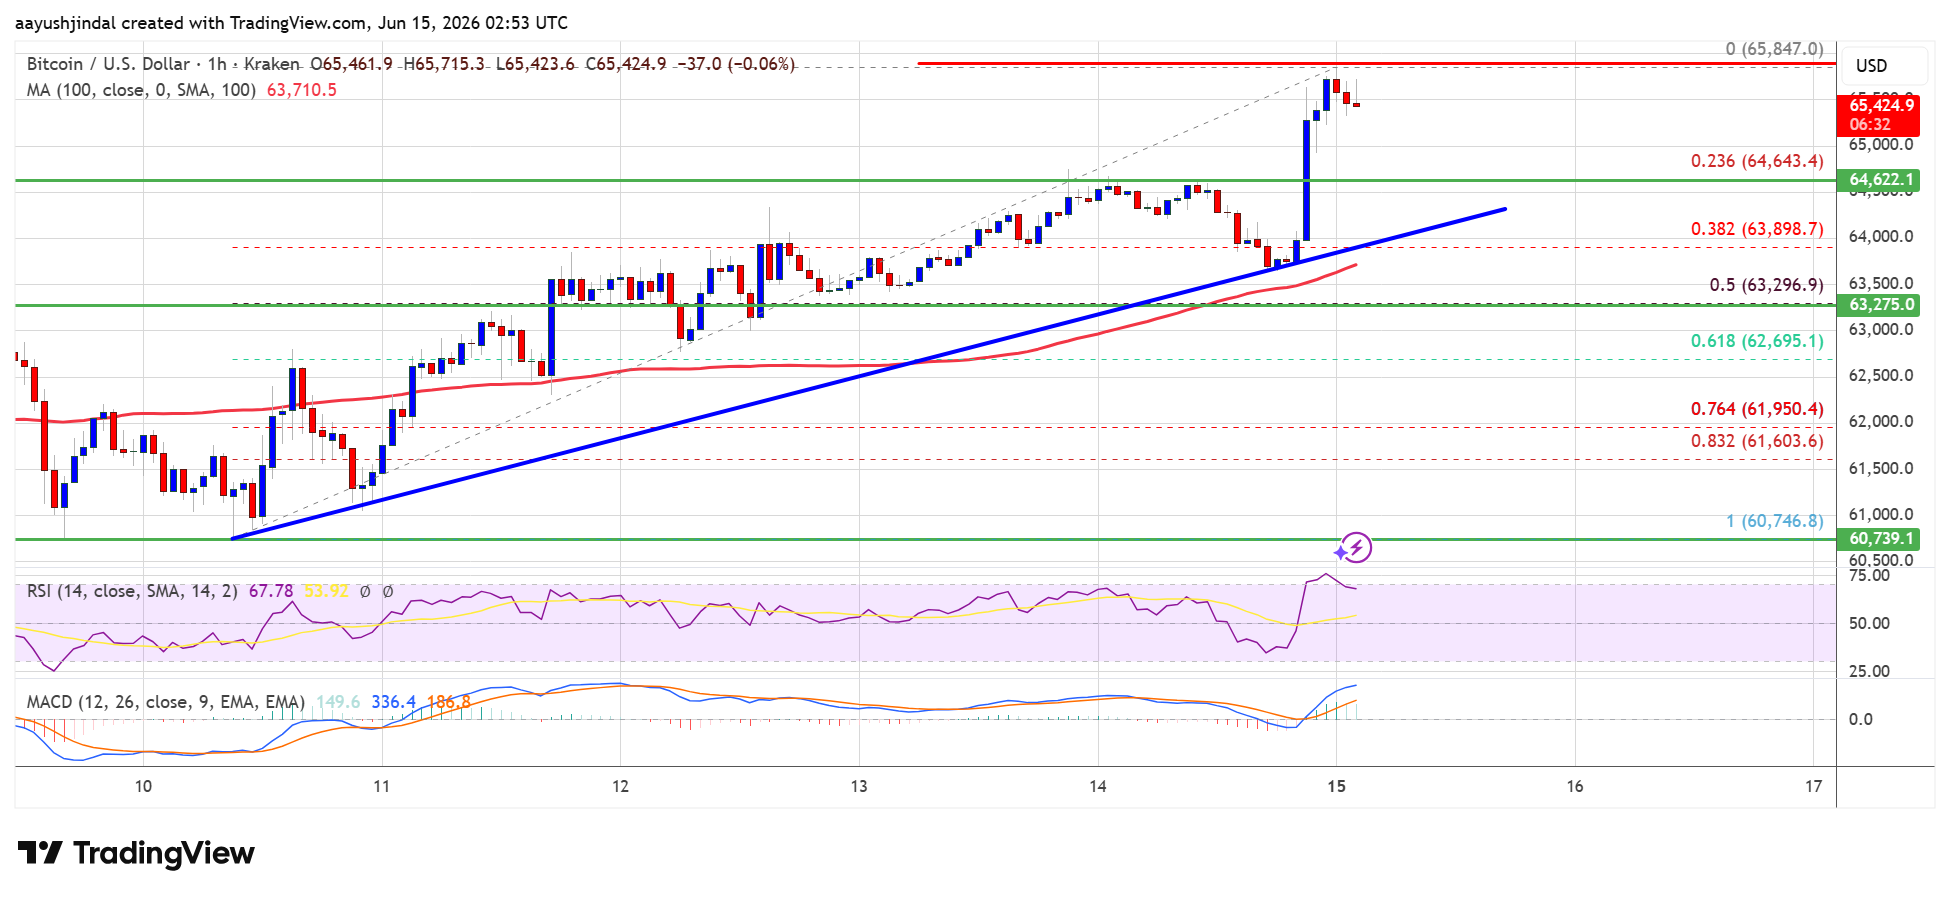
The bulls even pushed the price above $64,500. A high was formed at $65,847, and the price started a consolidation phase above the 23.6% Fib retracement level of the upward move from the $60,746 swing low to the $65,847 high.
Bitcoin is now trading above $64,500 and the 100 hourly simple moving average. Besides, there is a bullish trend line forming with support at $64,200 on the hourly chart of the BTC/USD pair.
 Source: BTCUSD on TradingView.com
If the price remains stable above $64,500, it could attempt a fresh increase. Immediate resistance is near the $65,500 level. The first key resistance is near the $66,200 level. A close above the $66,200 resistance might send the price further higher. In the stated case, the price could rise and test the $66,800 resistance. Any more gains might send the price toward the $67,500 level. The next barrier for the bulls could be $68,000.
Another Decline In BTC?If Bitcoin fails to rise above the $66,200 resistance zone, it could start another decline. Immediate support is near the $64,650 level. The first major support is near the $64,200 level.
The next support is now near the $63,300 zone or the 50% Fib retracement level of the upward move from the $60,746 swing low to the $65,847 high. Any more losses might send the price toward the $62,500 support in the near term. The main support now sits at $61,800, below which BTC might struggle to recover in the near term.
Technical indicators:
Hourly MACD – The MACD is now losing pace in the bullish zone.
Hourly RSI (Relative Strength Index) – The RSI for BTC/USD is now above the 50 level.
Major Support Levels – $64,650, followed by $64,200.
Major Resistance Levels – $65,500 and $66,200.
| # | Наименование новости | Тональность | Информативность | Дата публикации |
|---|---|---|---|---|
| 1 | Bitcoin Price Hovers Above $60K As Traders Search For Direction | 0 | 9.85 | 11-06-2026 |
| 2 | Solana (SOL) Back On The Defensive—Can Bulls Prevent Another Drop? | 0 | 9.1 | 10-06-2026 |
| 3 | Litecoin (LTC) Jumps 10%: Can the Bulls Fuel a Bigger Rally? | 0 | 8.98 | 16-10-2024 |
| 4 | Bitcoin stalls near $66K: is a bigger drop coming this week? | 0 | 11.24 | 31-03-2026 |
| 5 | Dogecoin (DOGE) Recovery Gains Traction—Can It Unlock Bigger Gains? | 0 | 9.38 | 15-06-2026 |
| 6 | Bitcoin price prediction: Is Strategy’s 1,550 BTC buy a bullish signal after the crash? | 0 | 9.38 | 08-06-2026 |
| 7 | Why Bitcoin price could fall below $62,000 despite oversold conditions | 0 | 13.06 | 04-06-2026 |
| 8 | Ethereum Price Rebound Gains Traction After Clearing Key Hurdles | 0 | 9.1 | 15-06-2026 |
| 9 | Bitcoin breaks critical support as dollar and oil move together, raising risk of a deeper drop | 0 | 7.05 | 02-04-2026 |
| 10 | Litecoin (LTC) at a Crossroads: Can It Rebound and Rally? | 0 | 7.2 | 21-11-2024 |