Просмотр новости
Найдите то, что Вас интересует
 Спутники
 РН
РН SpaceX
 Роскосмос
 NASA
NASA
СпутникиРНSpaceXРоскосмосNASACI optimization is easiest to reason about when the problem is concrete: one pipeline, one critical path, and one cost model. Lawmatics reached out to us with that kind of problem. Their application pipeline was already parallelized and already using a sensible CI structure. The remaining question was whether the most expensive part of the […]
The post How Lawmatics Cut CI Compute Cost by 39.3% and Shortened Pipeline Time by 15.8% appeared first on Semaphore.
CI optimization is easiest to reason about when the problem is concrete: one pipeline, one critical path, and one cost model.
Lawmatics reached out to us with that kind of problem. Their application pipeline was already parallelized and already using a sensible CI structure. The remaining question was whether the most expensive part of the pipeline was running on the right machine class.
The goal was not to make CI faster at any cost. It was to reduce compute spend without making developers wait longer for feedback.
That constraint shaped the work:
The result: Lawmatics reduced average application compute cost per pipeline by 39.3% while reducing active pipeline duration by 15.8%.
The Shape of the PipelineThe application pipeline had a common CI profile: a parallel browser-test section dominated both runtime and compute cost.
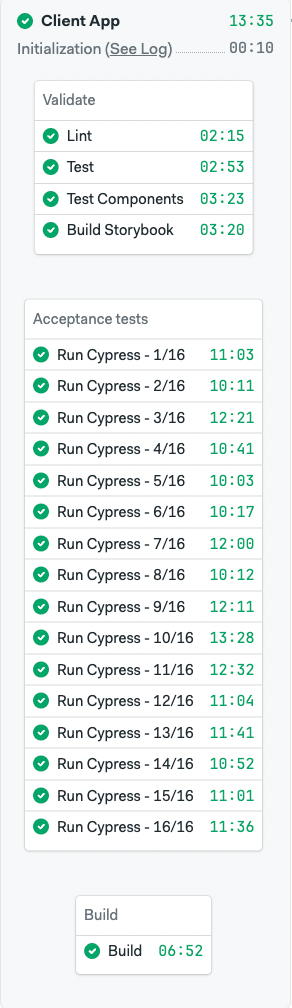
Before the change, the main browser end-to-end test section ran 16 parallel jobs on f1-standard-4 machines. For this analysis, f1-standard-4 cost $0.015 per minute. The smaller f1-standard-2 machine cost $0.0075 per minute, or 50% less per minute.
The question was whether the browser workload justified the larger runner.
Browser tests do not always scale cleanly with more CPU. A job can still spend time in setup, browser execution, network calls, file I/O, and single-threaded work. When extra CPU is not on the critical path, a larger runner can increase cost without improving feedback time enough to justify it.
The First RecommendationThe first recommendation was intentionally narrow:
We did not start by changing parallelism. On paper, reducing parallelism can look like an easy cost lever. In practice, it increases the amount of test work per job and can make the browser-test section slower.
The safer sequence was to change the machine class first, protect wall-clock time, and then re-evaluate parallelism with fresh data.
That sequencing matters. If machine type, parallelism, caching, database settings, and test distribution all change at once, the final result may still be good, but it becomes harder to understand which changes mattered.
What Lawmatics ImplementedThe final implementation went beyond the first runner-sizing recommendation. That is where Semaphore’s Customer Success team can be the most useful.
Semaphore brought the external view: runner sizing, pipeline structure, cost modeling, and measurement. Lawmatics brought the application context: which services were safe to tune, which caches were valid, and which build outputs could be reused.
The implemented changes included:
Some of these changes came from the initial recommendation. Some came from the Lawmatics team after the optimization work created a reason to inspect the pipeline more closely.
That is the right outcome. A good optimization engagement should not create dependency on an outside reviewer for every pipeline edit. It should give the team enough structure and signal to find the next improvements themselves.
What ChangedThe before sample contains 10 successful application pipelines. The after sample contains 10 successful application pipelines collected roughly two weeks after the production rollout.
Active pipeline duration excludes queue time. Queue time matters operationally, but it does not measure whether the pipeline itself became faster or slower.
| Metric | Before | After | Change |
|---|---|---|---|
| Application pipelines passed | 10/10 | 10/10 | |
| Browser-test jobs passed | 160/160 | 200/200 | |
| Browser-test parallelism | 16 jobs | 20 jobs | +25.0% jobs |
| Average browser job duration | 11:14.3 | 10:22.6 | -0:51.8 (-7.7%) |
| Average browser-test block duration | 12:50.4 | 10:47.1 | -2:03.3 (-16.0%) |
| Average active application pipeline duration | 13:05.0 | 11:01.1 | -2:03.9 (-15.8%) |
| Average browser-test compute cost per pipeline | $2.674 | $1.545 | -$1.130 (-42.2%) |
| Average application compute cost per pipeline | $2.860 | $1.737 | -$1.123 (-39.3%) |
| Average likely published passed tests per pipeline | 2,940.3 | 3,453.5 | +513.2 (+17.5%) |
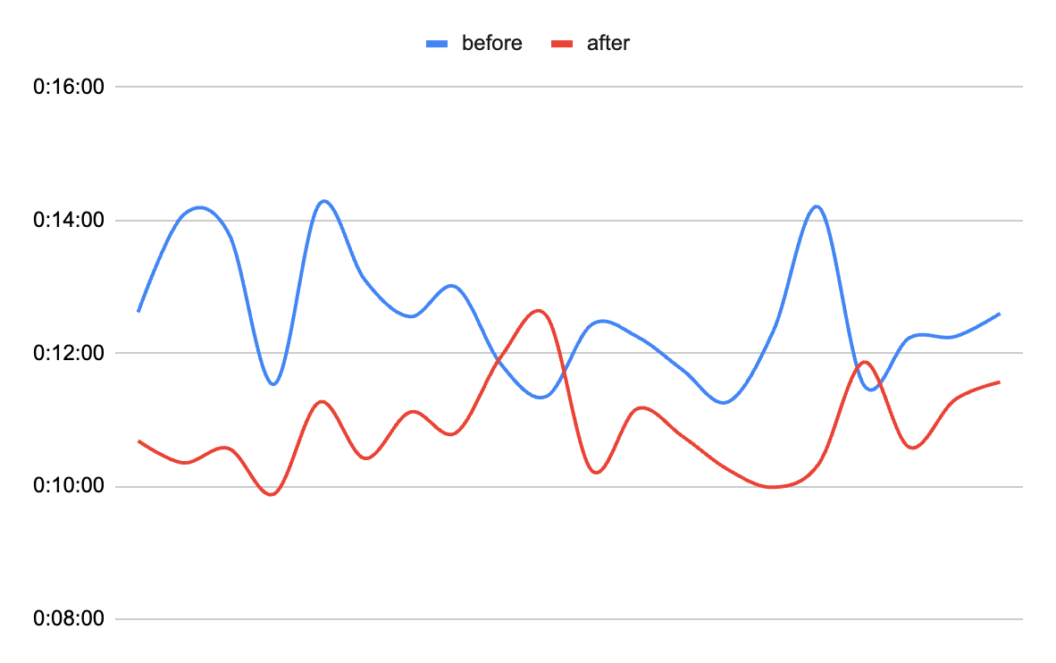
The browser-test section became faster and cheaper at the same time. Average browser-test block duration dropped from 12:50.4 to 10:47.1, a 16.0% improvement. Average active application pipeline duration dropped from 13:05.0 to 11:01.1, a 15.8% improvement.
The cost reduction followed the same pattern. The browser-test section moved to a runner with a 50% lower per-minute rate. Even after increasing parallelism from 16 to 20 jobs, average browser-test compute cost fell from $2.674 to $1.545 per pipeline, a 42.2% reduction. Average total application compute cost fell from $2.860 to $1.737 per pipeline, a 39.3% reduction.
The passed-test count makes the comparison more conservative. The likely published passed-test count increased from 2,940.3 per pipeline before the rollout to 3,453.5 after the rollout. That is a 17.5% increase in observed passed tests. The pipeline still ran faster and cost less.
The Tail Improved TooFor parallel browser tests, average job duration is useful, but the slowest job often determines when the whole section finishes. The tail matters.
In the before sample, the slowest browser job took 14:55.0. In the after sample, the slowest job took 11:51.0. The p95 job duration moved from 13:44.0 to 11:17.0.
That matches the implementation. More jobs reduced the amount of test work per job. Longest-spec-first ordering reduced imbalance. The smaller runner did not cause the tail to regress.
Why This WorkedThere was no single trick. The result came from matching several changes to the workload.
First, the most expensive section was right-sized. The previous machine type had a higher per-minute rate, but the browser workload did not appear to use the extra capacity in a way that justified the cost.
Second, feedback time was protected. Lawmatics did not simply move to cheaper machines and accept slower builds. Parallelism increased from 16 to 20 jobs, and test ordering reduced job imbalance. Wall-clock time improved while compute cost dropped.
Third, Lawmatics removed application-specific overhead. Database durability was unnecessary for a disposable CI database. Some setup work could run concurrently. Some build output could be produced once and reused. These are not generic YAML tips. They require application context.
Fourth, the team measured the result after rollout. The after data came from production pipeline runs collected roughly two weeks after the changes went live, not from a single proof-of-concept run.
The sample is still limited: 10 successful runs before and 10 successful runs after. But it is useful enough to show the direction and size of the improvement.
What This Says About CI OptimizationCI optimization works best when it is treated as shared engineering work, not a checklist of generic recommendations.
Semaphore brought runner sizing, pipeline mechanics, cost modeling, job timing, and a before/after measurement approach. Lawmatics brought the internal knowledge needed to make application-level changes safely.
That combination is why the outcome was larger than the first recommendation. The initial recommendation created a direction. The Lawmatics team used that direction to make deeper pipeline improvements.
A Practical Way to Approach Similar PipelinesFor teams with a similar CI shape, start with a few narrow questions:
The answer is rarely to apply every optimization at once. The better path is to isolate the first high-leverage change, roll it out with a rollback path, collect enough runs, and then decide what to tune next.
The TakeawayThe final numbers from this Lawmatics engagement are specific to one pipeline:
The broader lesson is the process. Start from the logs. Find the expensive critical path. Check whether the current machine class matches the workload. Protect feedback time while changing the cost basis. Then use the team’s application knowledge to remove overhead that only they can fully see.
That is what made this optimization work: a short sprint, real production data on both sides of the change, and a team that used the first recommendation as a starting point rather than the end of the work.
| # | Наименование новости | Тональность | Информативность | Дата публикации |
|---|---|---|---|---|
| 1 | Best CI/CD Tools in 2026: Performance and Cost Compared | 0 | 9.9 | 02-07-2026 |
| 2 | What CI/CD strategies work for embedded or IoT projects that require hardware testing? | 0 | 6.19 | 30-04-2026 |
| 3 | Best Jenkins Alternatives in 2026 | 0 | 10.09 | 24-07-2026 |
| 4 | Best GitLab Alternatives in 2026 | 0 | 10.14 | 30-07-2026 |
| 5 | Best CircleCI alternatives in 2026 | 0 | 11.25 | 31-07-2026 |
| 6 | Building an AI-Native CI/CD Experience with sem-ai | 0 | 12.84 | 27-05-2026 |
| 7 | Codex Support, Faster Task Creation, and Flaky Test Visibility | 0 | 13.05 | 04-06-2026 |
| 8 | Best GitHub Actions Alternatives in 2026 | 0 | 12.87 | 23-07-2026 |
| 9 | Rerun Only the Jobs That Failed | 0 | 5.39 | 12-08-2026 |
| 10 | Flaky Test API Now GA, New Auto-Fix Skill, Skill Quality Improvements | 0 | 9.02 | 19-06-2026 |