Просмотр новости
Найдите то, что Вас интересует
 Спутники
 РН
РН SpaceX
 Роскосмос
 NASA
NASA
СпутникиРНSpaceXРоскосмосNASABackground Cognitive decline has become a common sign of mental ability loss in mild cognitive impairment (MCI) and dementia-related diseases, such as Alzheimer’s disease (AD). However, early detection is difficult because traditional diagnostic tools such as brain scans are expensive, time-consuming, and depend on experts. Existing machine learning models show high prediction scores; however, they are uninterpretable because their logic is hidden, which limits trust. Therefore, this study aimed to develop a reliable and interpretable tool named COGNEUTEST, a clinical support cognitive decline assessment system. Methods This study utilized a tuned Random Forest classification model trained on comprehensive clinical features from the National Alzheimer’s Coordinating Center (NACC) cohort dataset. This framework focuses on the top 26 features, including patient demographics, medical conditions, lifestyle, and influential cognitive variables, to predict the objective cognitive status results. To ensure clinical accountability, a state-of-the-art SHapley Additive exPlanations (SHAP) technique was integrated to interpret each contribution. Results Experimental findings proved that tuned Random Forest showed the highest performance in identifying three cognitive classes, Normal Cognition, MCI and Alzheimer’s disease dementia, on the NACC dataset, which achieved 86.05% accuracy and an Area Under the Curve (AUC) of 0.9534. The system efficiently runs machine learning predictions and PDF report creation in an average of 13 s, and database lookups require less than 1 s. Conclusions This study contributes to the healthcare field by demonstrating the potential of providing a fast, transparent, and affordable assessment system that is accessible to low-income populations and clinics with limited budget. Limitations include reliance on a single cohort dataset and dependence on informant availability for Functional Activity Questionnaire (FAQ) variables. Future work should involve testing the model on other databases, exploring some deep learning models, and developing a separate model for cases in which a patient can perform self-testing at home.

Software Tool Article
[version 1; peer review: awaiting peer review]
1 Faculty of Information Science and Technology, Multimedia University, Ayer Keroh, Malacca, 75450, Malaysia
2 Centre for Advanced Analytics, CoE for Artificial Intelligence, Faculty of Information Science and Technology, Multimedia University, Bukit Beruang, 75450 Melaka, Malaysia
Yan San Tan
Roles: Conceptualization, Methodology, Visualization, Writing – Original Draft Preparation
Sook Ling Lew
Roles: Conceptualization, Funding Acquisition, Methodology, Supervision, Validation, Writing – Review & Editing
OPEN PEER REVIEW
REVIEWER STATUS AWAITING PEER REVIEW
Cognitive decline has become a common sign of mental ability loss in mild cognitive impairment (MCI) and dementia-related diseases, such as Alzheimer’s disease (AD). However, early detection is difficult because traditional diagnostic tools such as brain scans are expensive, time-consuming, and depend on experts. Existing machine learning models show high prediction scores; however, they are uninterpretable because their logic is hidden, which limits trust. Therefore, this study aimed to develop a reliable and interpretable tool named COGNEUTEST, a clinical support cognitive decline assessment system.
MethodsThis study utilized a tuned Random Forest classification model trained on comprehensive clinical features from the National Alzheimer’s Coordinating Center (NACC) cohort dataset. This framework focuses on the top 26 features, including patient demographics, medical conditions, lifestyle, and influential cognitive variables, to predict the objective cognitive status results. To ensure clinical accountability, a state-of-the-art SHapley Additive exPlanations (SHAP) technique was integrated to interpret each contribution.
ResultsExperimental findings proved that tuned Random Forest showed the highest performance in identifying three cognitive classes, Normal Cognition, MCI and Alzheimer’s disease dementia, on the NACC dataset, which achieved 86.05% accuracy and an Area Under the Curve (AUC) of 0.9534. The system efficiently runs machine learning predictions and PDF report creation in an average of 13 s, and database lookups require less than 1 s.
ConclusionsThis study contributes to the healthcare field by demonstrating the potential of providing a fast, transparent, and affordable assessment system that is accessible to low-income populations and clinics with limited budget. Limitations include reliance on a single cohort dataset and dependence on informant availability for Functional Activity Questionnaire (FAQ) variables. Future work should involve testing the model on other databases, exploring some deep learning models, and developing a separate model for cases in which a patient can perform self-testing at home.
Random Forest, Explainable Artificial Intelligence (XAI), SHapley Additive exPlanations (SHAP), Mild Cognitive Impairment (MCI), Alzheimer's Disease (AD), Cognitive Decline, NACC Dataset, Clinical Support System
Corresponding author: Sook Ling Lew Competing interests: No competing interests were disclosed.
Grant information: The author(s) declared that no grants were involved in supporting this work.
Copyright: © 2026 Tan YS and Lew SL. This is an open access article distributed under the terms of the Creative Commons Attribution License, which permits unrestricted use, distribution, and reproduction in any medium, provided the original work is properly cited. How to cite: Tan YS and Lew SL. Predictive Models for Cognitive Decline Assessment [version 1; peer review: awaiting peer review]. F1000Research 2026, 15:1194 (https://doi.org/10.12688/f1000research.185879.1) First published: 22 Jul 2026, 15:1194 (https://doi.org/10.12688/f1000research.185879.1) Latest published: 22 Jul 2026, 15:1194 (https://doi.org/10.12688/f1000research.185879.1)
Cognitive decline is a common syndrome ranging from normal age-associated cognitive deterioration to pathological mild cognitive impairment (MCI), which can further develop into dementia (Chun et al., 2021). Prevention of cognitive decline is becoming more urgent for everyone, especially in the late-life population. Ageing population may have the possibility of losing the ability to remember, think, focus and learn. Many of these patients suffer from cognitive decline (Tong et al., 2025). If such conditions are not detected early, they may progress to MCI or even more serious dementia-related diseases or neurodegenerative diseases, such as Alzheimer’s disease (AD) and vascular dementia, that can eventually impair older adults’ cognitive function and cause mental disability, which in turn affects their thinking, behavior, and emotion.
According to this World Health Organization (World Health Organization, 2025) study, 57 million people were diagnosed with dementia in 2021, and 60% to 70% had AD, the most common dementia-related disease. Aside from normal aging, risk factors that can lead to cognitive decline include lifestyle factors such as smoking, alcohol overconsumption, and poor sleep; medical conditions including hypertension, diabetes, and obesity; and mental health issues such as depression. Until the current research, there was no existing effective treatment for dementia-related diseases, but they can be detected (Ford et al., 2023; Hafiz et al., 2023). The current clinical diagnosis is mainly determined by a physician’s judgement through neurological examinations, laboratory tests, brain imaging tools such as Magnetic Resonance Imaging (MRI) and Positron Emission Tomography (PET), and cognitive screening tools such as the Montreal Cognitive Assessment (MoCA) and Mini-Mental State Examination (MMSE) (Chun et al., 2021; Mayo Clinic, 2024a). However, trained professionals are required, and it is time-consuming to administer. Hence, with the help of advanced technologies such as machine learning (ML) in the healthcare field, the importance of early detection systems for cognitive decline or other dementia-related diseases is emphasized. Predictive models are beneficial for medical practitioners to analyze and identify possible causes and provide appropriate interventions.
The significance of this study lies in its potential contribution to this global health crisis. Through a comprehensive analysis of existing clinical data and the application of machine learning techniques, this study explored the effectiveness of integrating influential clinical features into an assessment system. The findings of this project will help to increase the practicality and applicability of ML techniques in cognitive decline assessment by showing how predictive models and XAI can assist medical practitioners in making informed decisions. In addition, this system has the potential to be further enhanced and utilized in the healthcare field, as well as to encourage proactive cognitive health monitoring among aging populations.
By integrating an optimized machine learning model and XAI techniques, such as SHapley Additive exPlanations (SHAP), this study seeks to advance the understanding of cognitive decline prediction within the framework of AI-driven healthcare. Instead of developing a confusing uninterpretable predictive model, this approach creates a transparent, interpretable, and efficient assessment system that provides clinical insights to improve clinical workflows, save time, and allow medical practitioners to make more informed treatment decisions.
Currently, dementia is one of the leading causes of death and a major cause of disability in older adults. AD accounted for the largest proportion of the cases (World Health Organization, 2025). There is currently no proper medical treatment for this condition. Neurological tests, laboratory tests, and brain imaging methods used to detect them require highly skilled medical professionals to administer, which may take a long time to obtain, and brain imaging tools are costly and limited, especially for middle-to low-income groups. Because of these conditions, clinicians will make judgments based on their own experience, which may not always match the results of these standardized measurement methods. Therefore, it is challenging to identify the cognitive condition at the appropriate stage to prevent the brain from deteriorating to a great extent.
Although recent literature has explored ML techniques in healthcare, existing predictive models are heavily restricted by binary classification problems such as normal versus cognitive impairment or dementia (De Palma et al., 2025; Nabavi et al., 2024; Sharma & Midhunchakkaravarthy, 2023). There is still a need to explore the potential of ML techniques for early detection, especially during stages when symptoms are not easily noticeable. As more research is conducted in this area, there is a greater possibility of finding effective solutions for early cognitive decline detection systems for dementia-related diseases. In addition, traditional ML algorithms often function as uninterpretable models that limit accountability and adoption by medical practitioners (Markham, 2025). Clinical decisions often require informed consent, and practitioners must be able to provide medical judgement for a model’s output to respect the patient (Mourby et al., 2021). Consequently, there is a need for a multiclass, computationally robust, and highly transparent assessment framework that can process comprehensive clinical data to provide both accurate classification tasks and interpretable insights without relying on costly imaging datasets.
Therefore, the demand for a reliable, efficient, and convenient detection system to identify cognitive deterioration is high, and ML techniques are suitable, as they are widely used in disease prediction. One reason for this is their high computational capacity, which means that they can process a large amount of clinical data and identify complicated patterns and relationships. Using ML techniques to train predictive models can provide predictions based on the patterns learned from the data. This drift helps physicians to make treatment decisions.
The general objective of this study was to develop an early cognitive decline assessment system using machine learning techniques to create a suitable predictive model for the system, and thus assist medical practitioners in detecting individuals who are at risk of cognitive decline or AD. The specific objectives were as follows: (1) To develop accurate machine-learning predictive models for cognitive decline assessment. (2) To evaluate the clinical applicability of predictive models using performance metrics. (3) Creating a functional system using the best-performing predictive models for early cognitive decline assessment.
As people age, there is a natural process of gradual deterioration in cognitive function or mental abilities, such as short- and long-term memory, attention, decision-making, and problem-solving. This gradual deterioration is referred to as a cognitive decline. Cognitive decline is due to changes in the central nervous system of the brain, such as shrinkage of the cerebral cortex, or peripheral factors, such as vascular dysfunction, that impair cognitive function (Jost & Kujach, 2025). Several risk factors include age, lifestyle, medical history, and mental health issues (World Health Organization, 2025). While a mild decline is associated with normal aging, some significant changes may indicate a severe disorder. The development of decline is commonly described across three main conditions, from normal to MCI to dementia, where AD accounts for most cases of dementia.
MCI represents a stage between normal age-related cognitive changes and dementia. Individuals with MCI experience noticeable cognitive difficulties. For example, individuals with cognitive decline will be forgetful, find it difficult to converse and remember schedules, and feel overwhelmed when performing complex tasks or multitasking tasks (Mayo Clinic, 2024a; Stanborough, 2024). However, these symptoms are not severe enough to affect activities of daily living. MCI is an important stage because it is one of the earliest detectable stages in the progression towards dementia-related diseases, particularly AD. It can remain the same or even be improved. Research studies carried out in memory clinics have shown that 10-15% of people with MCI with gradual memory loss each year develop dementia, usually AD (Alzheimer’s Disease Foundation Malaysia [ADFM], 2025). Therefore, diagnosing MCI is crucial for individuals with MCI, as it may help reduce the risk of developing dementia-related illness in later years.
Dementia is an umbrella term for a collection of cognitive decline symptoms that are severe enough to disrupt an individual’s daily life. However, it is not a specific disease. It can be considered a more severe stage following MCI and is irreversible. Dementia is caused by various diseases, including AD, vascular dementia, and frontotemporal dementia (Xu, 2025). These diseases cause damage to the brain cells, which affects cognitive function. Individuals with these diseases are unable to communicate normally. Thinking, feeling, and behavior can also be affected progressively, regardless of the type. Compared with MCI, dementia symptoms are more severe, including memory loss, confusion, personality changes, and repeated words within a conversation. Due to its irreversibility, it has become a major public health concern (World Health Organization, 2025).
The most common cause of dementia is AD, which accounts for 60–70% of all dementia cases (World Health Organization, 2025). AD is a progressive neurodegenerative disorder. The symptoms gradually worsened over the course of several years. However, this is not a normal feature of aging. Although AD is the most common case in people over 65 years of age, which is also known as late-onset Alzheimer’s disease (LOAD), people aged < 65 years may have AD, which is known as early onset Alzheimer’s disease (EAOD). From a medical perspective, this is caused by the increase in beta-amyloid plaques and tau tangles that cause damage to brain cells (Sirkis et al., 2022). Since AD is a type of dementia-related disease, it also affects memory, thinking, and daily functioning that impair individuals’ cognitive function in day-to-day activities. However, it combines with biomarker evidence such as amyloid levels in brain changes associated with AD. In addition to the general risk factors that cause cognitive decline, genetic factors play an important role in AD. Individuals with the form of a gene, Apolipoprotein Epsilon 4 (APOE-e4), have an increased risk of LOAD (Mayo Clinic, 2024b).
Overall, cognitive decline progresses from normal age-related changes to mild cognitive impairment (MCI) and advanced AD dementia. Neurodegenerative conditions are irreversible once they reach the stage of dementia. Therefore, the early stage of MCI is the most important stage for doctors to check patients, so that minor changes in a person's attention, thinking speed, and other brain abilities to handle daily chores can help families plan earlier before the condition worsens.
Recent studies have applied ML to develop predictive models for cognitive impairment, dementia or AD. Traditional ML models, including Logistic Regression (LR) and Support Vector Machine (SVM), as well as tree-based algorithms, such as Random Forest (RF) and Extreme Gradient Boosting (XGBoost), are frequently used to detect cognitive impairment, dementia, or AD. These models are trained to learn complex patterns from various clinical datasets, and are evaluated to determine whether the best-performing model can generate accurate results and serve as an auxiliary tool in the healthcare field. These studies commonly utilize datasets such as the National Alzheimer’s Coordinating Center (NACC), Alzheimer’s Disease Neuroimaging Initiative (ADNI), or Kaggle platform, which provides various clinical and cognitive data. This section reviews the most relevant studies published between 2021 and 2025. For each study, the study purpose, datasets used, best-performing model performance, involvement of XAI techniques, strengths, and limitations are discussed.
Starting with studies that focus more on cognitive impairment in MCI. One study by Hu et al. (2021) aimed to develop an ML-based prediction model for cognitive impairment in elderly people with normal cognitive function living in Chinese communities. 2008-2011 Chinese Longitudinal Healthy Longevity Survey (CLHLS), which included 6718 elderly individuals, was used as the dataset. Four ML algorithms were used to assess the three-year risk of developing cognitive impairment. As a result, both LR and Naïve Bayes (NB) had best predictive performance with 0.814 of Area Under the Curve (AUC) as well as accuracy of 75.9% and 76% respectively. In this study, a large dataset was used to increase reliability. However, it has cohort bias as healthier participants are more likely to remain, which can affect true risk prediction. In addition, there is a need for the external validation of independent populations to improve generalizability.
Similarly, Wang et al. (2022) used the CLHLS dataset that covered waves from 2002 to 2014 as the dataset to explore the prediction of cognitive impairment at an early stage and identify factors that may help slow the cognitive decline rate among communities over three years. Several ML models, including stacking models, have been evaluated. SVM achieved the highest single-model, with an AUCs of 0.8267. By fusing all single models into a stacking ensemble model, the AUC slightly improved to 0.8269. The strengths of this study include its large longitudinal cohort and diverse comparisons across ML models. However, there is no external validation, relying on self-reported behaviors that may introduce bias and lacking the use of biological markers that can increase the prediction rate.
The next study by Revathi et al. (2022) proposed a two-stage ML classification model for the early prediction of cognitive decline using 2361 middle-aged patient from the Data World Repository. In the first stage, SVM and RF algorithms were used to identify risk individuals and the associated risk factors of Alzheimer’s disease. In the second stage, the results of the Cognitive Ability Test (CAT) that was conducted on the individuals identified by the classifier in the first stage were used with multinomial logistic regression to classify cognitive severity. SVM performed the best in the first-stage classification with 86% accuracy and 0.90 AUC, and multinomial logistic regression achieved 0.89 accuracy and 0.92 AUC in the second-stage classification. The strengths of the proposed model include cost-effectiveness because it relies on clinical health records rather than expensive neuroimaging data, and the two-stage model improves classification accuracy compared to the single-stage model. Nevertheless, a small dataset size limits the model’s generalizability, the CAT test is a simple tool that may miss subtle cognitive changes, and limited algorithms have been explored to reduce diversity.
Another study by Patil & Kukreja (2024) developed an SVM-based early identification system for cognitive-skill impairments. The dataset was self-collected from various sources, including hospitals, the elderly, orphanages, and online Google forms, and 60 people aged 55 to 75 years were chosen. After the SVM model was tested, it achieved an 83% accuracy rate in predicting impairment levels. Although the proposed work targets the timely detection of cognitive decline, which is crucial for intervention, the dataset size is too limited to restrict generalizability. In addition, only a single algorithm was evaluated, and there was no comparison with the other ML models.
Shubar et al. (2024) developed a cost-effective model to predict the risk of cognitive impairment over a period of up to five years using the National Alzheimer’s Coordinating Center Uniform Data Set (NACC-UDS) dataset. Several ML models were also assessed. The SVM model was the best model, with an accuracy of 87.7% and a generalizability test score of 0.71. The strengths include its focus on cost effectiveness and accessibility, and the use of easily obtainable data rather than expensive neuroimaging data. However, the study relied on simplistic forward and backward filling techniques to handle missing data in the dataset, which may have introduced bias.
Moreover, Oh et al. (2024) assessed several ML models to detect MCI and dementia onset using the 2018–2020 Korean Longitudinal Study of Aging (KLoSA) dataset. The class imbalance of this dataset was addressed using class weights to reduce the bias towards the majority class. Among all the assessed models, RF had the best result in MCI prediction, with an AUC of 0.67, and XGBoost performed the best in dementia prediction, with an AUC of 0.82. Shapley values were used for both MCI and dementia in this study to identify the influential predictors. The strengths of this work include the evaluation of diverse ML models, use of Shapley values to interpret feature importance, and separate prediction of MCI and dementia instead of combining them into one category. Conversely, the dataset has severe class imbalance that still affects the precision. Although class weight reduced the bias, the features lacked biomarker data that could improve prediction, and the outcomes may have limited generalizability because only the Korean population was included.
Zhu et al. (2024) conducted a study on 463 patients with normal cognition to develop predictive models that can predict the future risk of MCI and to prevent MCI cognitively normal individuals with MCI. Three datasets were obtained from this longitudinal retrospective study. The first dataset included clinical variables, the second dataset included imaging variables, and the third dataset included both variables. Five models were evaluated using feature selection via Recursive Feature Elimination (RFE). The best-performing model was XGBoost, which was applied to the combined clinical and imaging variables and achieved 94.32% accuracy. The strengths of this study include its longitudinal dataset and the combination of imaging and clinical variables. On the other hand, limitations include small sample sizes that limit generalizability.
In addition, Zhang et al. (2025) developed explainable machine learning models for the early detection of MCI in older adults with chronic pain to enhance their cognitive health. Data were collected from 612 older patients at a hospital. Important variables were selected via the Least Absolute Shrinkage and Selection Operator (LASSO) and Support Vector Machine-Recursive Feature Elimination (SVM-RFE), and dataset imbalance was addressed using the Synthetic Minority Oversampling technique and Tomek Links (SMOTETomek) sampling method. By comparing nine ML models, XGBoost achieved the best performance, with an accuracy of 88.3% and AUC of 0.925. SHAP analysis was used to interpret the outcome of the XGBoost model and found that pain level, age, and depression were the top contributors to MCI risk in this case. The strengths of this study include careful feature selection, diverse ML models evaluated, and the use of interpretable SHAP analysis. However, it is limited by a cross-sectional dataset that cannot establish causality, and this dataset limits generalizability as it was only conducted in the Chinese population.
Next, one study by Tan et al. (2023) developed an ensemble model for the early diagnosis of cognitive impairment in Singapore. Data were obtained from 911 participants aged 60–88 years from the Epidemiology of Dementia in Singapore. The synthetic minority oversampling technique (SMOTE) was applied to the training data to reduce bias. Three classifiers, including LR, SVM and Gradient Boosting Machine (GBM), were trained, and the predictions were combined in an ensemble model using a majority vote. As a result, the ensemble achieved an accuracy of 83% and an AUC of 0.80, better than the individual models. SHAP analysis was used to identify important predictors of the ensemble. In this study, strength includes good interpretability using SHAP analysis, while limitations involving missing lifestyle factors as well as the cross-sectional design showed correlation and no evidence of causality.
Furthermore, Nabavi et al. (2024) investigated the early prediction of cognitive impairment in adults aged 20 years and above using the 2011–2014 National Health and Nutrition Examination Survey (NHANES) data. Outliers in the dataset were detected using Density-Based Spatial Clustering of Applications with Noise (DBSAN), imbalance was solved by SMOTE, and features were selected using RFE. The stacking ensemble model achieved the best performance, with an AUC of 0.778, compared to the individual classifiers. The SHAP analysis was used to improve the interpretability of the model. The strengths of this study include the large dataset that incorporates environmental biomarkers and the use of SHAP to provide interpretability, while its limitations involve its reliance on cross-sectional NHANES data and lack of longitudinal validation.
Moving to studies that focus more on dementia. One study by Kabir et al. (2023) developed an ML predictive model for early detection of dementia in Bangladesh. The dataset was collected from the Kaggle website and contains data from 374 patients. Four models were evaluated, and among these, KNN exhibited the best performance, with an accuracy of 96%. In this study, its strength demonstrates good predictive accuracy with simple ML algorithms, but its limitations include a lack of preprocessing to solve data inconsistencies and a lack of locally collected data from Bangladesh.
Another study by Dhakal et al. (2023) proposed an ML framework to predict dementia using longitudinal MRI data collected from the Open Access Series of Imaging Studies (OASIS) dataset. Features were selected using LASSO and Chi-square tests. Multiple ML algorithms were evaluated, and among these, the SVM with full features achieved the best performance with an accuracy of 96.77%. The strengths of this work include a comprehensive comparison of ML algorithms and a robust preprocessing method, whereas its limitations involve a small dataset that lacks generalizability.
The next article by Sharma & Midhunchakkaravarthy (2023) proposes an explainable XGBoost model for the early detection and diagnosis of dementia. The dementia-prediction dataset was obtained from the Kaggle website. The class imbalance was solved using the SMOTE method. In this study, XGBoost achieved an accuracy of 93.33%. Local Interpretable Model-agnostic Explanations (LIME) and SHAP were used to interpret XGBoost and were compared to determine which was more reliable. As a result, SHAP provides more clinically meaningful insights than LIME does. In this study, the strength is the use of LIME and SHAP to provide interpretable insights, while the limitations include small dataset size causing less generalizability, lack of ML model comparison, and no further validation.
A similar study conducted by Jahan et al. (2025) focused on early dementia detection using ML and XAI techniques to improve the diagnostic accuracy and provide interpretable insights. The “Dementia Patient Health, Prescriptions ML dataset” was obtained from Kaggle website and six ML classifiers were tested. The LightGBM classifier had the best prediction with 98% accuracy and an AUC of 0.97. Permutation significance and XAI techniques such as SHAP and LIME were used to interpret LightGBM. The strengths of this study include the use of LIME and SHAP to provide interpretable insights and to compare multiple ML algorithms. However, generalizability may be limited because the dataset covered the UK population only.
The following studies have focused on AD. One study by Nurma Sari et al. (2022) presented a Flask web-based system for early detection of AD using an SVM classifier. The Alzheimer's analysis dataset was obtained from the Kaggle website. Based on the result, SVM achieved an accuracy of 85% but low recall, hitting 25%, indicating low sensitivity in detecting Alzheimer’s cases. Its strength lies in the development of a practical web-based system that provides access to medical administrators. Conversely, the limitations involve no comparison with other classifiers, low recall, and a limited dataset.
Moreover, Alroobaea et al. (2021) introduced an ML-based computer-aided diagnosis system for Alzheimer's disease detection. It employed two datasets: the Alzheimer’s Disease Neuroimaging Initiative (ADNI) and OASIS. Several classifiers are evaluated. Based on the results, LR achieved the highest accuracy of 99.43% and SVM achieved the second-highest accuracy of 99.10% on the ADNI dataset, whereas for the OASIS dataset, LR achieved 84.33% and RF achieved 83.92% accuracy. In this study, strengths involve the use of two widely recognized neuroimaging datasets and comparisons across multiple algorithms, whereas limitations include limited generalizability due to the focus on imaging-based datasets and lower performance on OASIS compared to ADNI.
Kavitha et al. (2022) applied various ML techniques to improve the early detection of Alzheimer’s disease to enable timely intervention. “MRI and Alzheimer’s” dataset that used in this study can be obtained from Kaggle and OASIS platform. It included longitudinal MRI scans and contained 150 records. Among all the models evaluated, the best models that achieved high prediction rates were RF and XGBoost with 86.92% and 85.92% accuracy, respectively. The strength of this study was that diverse models were compared and evaluated. However, the dataset is too small, which limits generalizability, and does not include features such as age or lifestyle factors that could enhance prediction in the early detection of AD.
Next, Chandralekha et al. (2023) explored several ensemble ML models for AD detection. The selected dataset was obtained from the Kaggle website. Principal Component Analysis (PCA) was applied for feature extraction and to understand the importance of features. Among all ensemble ML methods, RF and Extra Trees (ET) achieved the best results with an accuracy of 86.7%. The strength of this study was the use of PCA to reduce dimensionality and understand feature importance. Limitations include the difficulty in classifying patients that develop from MCI to AD as well as limited generalizability due to the absence of external validation.
In addition, in Filiz Balbal (2024) study, ML-based predictive models were used to determine the presence of AD using the AD dataset from the Kaggle website, which contains 2149 records. Several widely recognized ML algorithms were tested, and among them, XGBoost achieved the best predictive capability with 95.35% accuracy. The strength of this study lies in its diverse useful features in the selected dataset. However, the limitations are the lack of generalizability, interpretability, and clinical validation.
A study by Trivedi et al. (2025) also used the same Alzheimer's Disease dataset from the Kaggle website to compare several ML models in AD prediction. Based on the results, XGBoost exhibited the best performance, with 94.4% accuracy and an AUC of 0.947. The main strength of this study is the robustness of the ensemble XGBoost method, which can reduce the overfitting problem and maintain the predictive reliability. However, generalization was limited because the models were trained on a single dataset only, and reduced interpretability compared to traditional methods such as logistic regression.
Another study that used the same Alzheimer's Disease dataset was Wahyudi & Abdulloh (2025) that aimed at optimizing the RF algorithm for AD detection using random search hyperparameter optimization. SMOTE was applied to balance the class distribution in the dataset. Based on the results, the optimized RF model achieved an accuracy of 97%. The strengths of this study include the use of SMOTE to balance the dataset and the application of hyperparameter tuning to enhance performance. However, limitations involve reliance on a single dataset, the absence of comparisons with other ML models, and the lack of interpretability, which limits clinical applicability.
Next, De Palma et al. (2025) proposed an RF model predicting MCI in cognitively normal patients in Alzheimer's research using the ADNI Merge multimodal dataset that integrated the profile of genetic, biochemical, and neuroimaging biomarkers. SMOTE was used to address class imbalance. Based on these results, the RF classifier achieved an accuracy of 76% and an AUC of 0.8. A strength of this study was the use of a well-established cohort. However, limitations include struggles in identifying MCI compared to normal cases and the lack of other model comparisons.
Finally, a special study by Guillén & Frias-Martinez (2025) evaluated the use of Automated Machine Learning (AutoML), specifically the PyCaret framework, for AD diagnosis and prognosis. The study used the NACC-UDS dataset, which contains large longitudinal clinical data, and its class imbalance was handled using SMOTE. Two experiments, diagnosis that classifies Normal Cognition, MCI and AD, as well as prognosis that predicts future cognitive states after four years were conducted. In the diagnosis experiment, XGBoost from PyCaret achieved 98.6% accuracy for NC vs. AD, 91.3% accuracy for NC vs. MCI, and 92.5% accuracy for MCI vs. AD. For multiclass NC vs. MCI vs. AD, ET performed the best, with 89.5% accuracy. For prognosis experiments, LightGBM from PyCaret achieved the highest accuracy in NC vs. AD, with 92.8% accuracy. ET achieved the highest accuracies of 82.7%, 90.2%, and 81.4% in NC vs. MCI, MCI vs. AD, and NC vs. MCI vs. AD, respectively. SHAP explainability was integrated to understand the influential features. The strengths include the use of AutoML to automate model selection and hyperparameter tuning and the use of SHAP for transparency. The limitations involve PyCaret’s limited support for deep learning and its focus only on a single dataset.
In these studies, the strength achieved a high classification performance across uniform datasets. However, some limitations remain, as many studies suffer from a limited dataset size, limited generalizability, limited algorithms tested, or function as uninterpretable black boxes that lack clinical transparency. Hence, these findings provide a clear need for a framework that can evaluate multiple useful algorithms in a real-world cohort and achieve high multiclass predictive performance with transparent explanation techniques. Relevant studies, along with their strengths and limitations, are presented in Table 1.
Several studies have mentioned the use of XAI and its application in their work. It is often used to elucidate the internal process of the “black box,” which refers to predictive models, particularly complex ML architectures. In the context of cognitive impairment, dementia, and Alzheimer’s disease detection, interpretability is important for practitioners to understand why the model will produce a particular prediction and which features will influence the prediction the most.
Among all the reviewed articles, the most commonly used XAI techniques were Local Interpretable Model-agnostic Explanations (LIME) and SHapley Additive explanations (SHAP). LIME provides local explanations for individual prediction by creating slightly changed samples around one instance and fitting them into a simple interpretable model such as linear regression. In contrast, SHAP provides global and local explanations derived from Shapley values from cooperative game theory, which calculates each feature contribution by considering every possible combination of other features. Specifically, positive SHAP values indicate that certain features support the prediction and vice versa (Jahan et al., 2025; Sharma & Midhunchakkaravarthy, 2023).
Studies such as Jahan et al. (2025) utilized both XAI techniques to interpret the LightGBM model developed to detect dementia. Using SHAP and LIME, this study found that the dosage of prescribed medication, depression status, APOE-e4 gene presence, and alcohol level were the most influential factors in detecting dementia. Similarly Sharma & Midhunchakkaravarthy (2023) applied both explainers to an XGBoost model that was used to detect dementia as well. Their study found that SHAP provided higher clinical relevance as influential features such as the Clinical Dementia Rating (CDR) and MMSE scores, whereas LIME emphasized less relevant features such as socioeconomic status.
The majority of the articles mainly employed SHAP to determine the feature importance. For instance, Tan et al. (2023), Nabavi et al. (2024) and Zhang et al. (2025) used SHAP on the ensemble model, stacking ensemble model, and XGBoost model, respectively to determine the most influential predictors in cognitive impairment detection. Age and educational level were identified as top risk factors. Ethnicity and neuroimaging markers were also recognized as important predictors in Tan et al. (2023) study. Heavy metal biomarkers such as urinary cadmium and blood manganese, aside from sex, depression severity, and hypertension, were important factors in Nabavi et al. (2024) study, while pain level, pain sites, pain duration, depression, and sleep quality were risk factors in Zhang et al. (2025) study. Furthermore, Oh et al. (2024) utilized SHAP values in the RF model and XGBoost to discover powerful predictors, including pain, widowhood, exercising, and social factors such as living alone in MCI and dementia prediction. Guillén & Frias-Martinez (2025) showed through AutoML and SHAP that cognitive features, including memory, judgement, communication, and orientation, were the most influential predictors, and genetic markers were also meaningful.
These studies showed that XAI is a useful tool in clinical settings because it can transform complicated machine learning into clear visual insights. This allows medical practitioners to understand the reasons for a model's diagnostic predictions. Table 2 presents the specific explainable AI techniques, baseline machine learning models, and top clinical predictors identified in the reviewed studies.
The reviewed articles used a variety of data sources, including large longitudinal clinical repositories, surveys, open-access platforms, and self-collected methods for cognitive impairment, dementia, and AD detection. These studies typically used either a longitudinal or cross-sectional design. Longitudinal studies track the same individuals over a certain period that allows researchers to perceive disease progression and pattern, whereas cross-sectional studies collect data at a specific time, which provides an overview of prevalence without tracking changes. Therefore, the longitudinal dataset is more reliable. The datasets employed from these sources influence the clinical applicability of predictive models, as different dataset features, population characteristics, and modalities can determine model outcomes and generalizability.
Several studies have used large surveys to identify the sociodemographic and lifestyle risk factors that affect cognitive function over time. For instance, the Chinese Longitudinal Healthy Longevity Survey (CLHLS) was used by Hu et al. (2021) and Wang et al. (2022) in their studies to predict cognitive impairment among older adults in the Chinese community. Similarly, Oh et al. (2024) analyzed data from the Korean Longitudinal Study of Aging (KLoSA) were used to assess demographic, health, and socioeconomic risk factors within the Korean population. Nabavi et al. (2024) conducted a cross-sectional analysis using the U.S. National Health and Nutrition Examination Survey (NHANES) which provided unique data on environmental heavy metals related to cognitive decline. Tan et al. (2023) used the Epidemiology of Dementia in Singapore (EDIS) dataset was used to investigate cognitive decline among Chinese, Malay, and Indian participants. These datasets have large sizes and national representation of populations, but some parts of the dataset rely on self-reported data such as lifestyle habits that can cause recall bias and affect data reliability.
Some studies have employed multimodal clinical or neuroimaging datasets to train their predictive models. For example, the Alzheimer’s Disease Neuroimaging Initiative (ADNI) is frequently used for AD detection, which includes MRI, PET, Cerebrospinal Fluid (CSF) biomarkers, genetics, and clinical and cognitive modalities. Similarly, the Open Access Series of Imaging Studies (OASIS) has been used in dementia and AD research, and it offers longitudinal neuroimaging data and clinical assessments. Studies such as Alroobaea et al. (2021) utilized these repositories to train ML predictive models. Moreover, the National Alzheimer’s Coordinating Center (NACC) dataset, which includes clinical, cognitive, neuropathological, and genetic modalities, has been applied in studies, such as Shubar et al. (2024) and Guillén & Frias-Martinez (2025) for modelling cognitive impairment and AD. These datasets are widely utilized in this kind of study because of their high quality, standardized measurements, and longitudinal format. These datasets are the most suitable for healthcare research. However, they often require complicated preprocessing pipelines to handle multimodal patterns and missing values.
Many studies have relied on open-source datasets that are easily accessible via the Kaggle platform. For example, Kabir et al. (2023), Sharma & Midhunchakkaravarthy (2023) and Jahan et al. (2025) utilized dementia-related datasets from Kaggle to analyze dementia. Correspondingly, Nurma Sari et al. (2022), Kavitha et al. (2022), Chandralekha et al. (2023), Filiz Balbal (2024), Trivedi et al. (2025) and Wahyudi & Abdulloh (2025) used Alzheimer’s-related datasets to analyze AD. Publicly available datasets are convenient and suitable for fast experimentation, but some are small, cross-sectional, and synthetic, which restricts their practical applicability.
In contrast to public datasets, only a few studies have collected data from multiple sources. Patil & Kukreja (2024) collected data from hospitals, senior citizens, orphanages, and online surveys. Zhang et al. (2025) collected a cohort of older patients with chronic pain from a hospital in Nanchang, China. Self-collected data can provide clinically relevant variables but are limited by smaller sample sizes and cross-sectional sizes.
Overall, the different dataset repositories offer distinct advantages and limitations. Clinical repositories such as ADNI, OASIS, and NACC provide high-quality complex data, and population-based surveys and open-access datasets offer broader accessibility. Thus, careful selection of a suitable dataset repository is needed to ensure data validity, clinical significance, and reliability.
Although advanced techniques such as ML and other robust preprocessing methods used in relevant articles have developed good predictive models for MCI, dementia, and AD detection, several gaps exist.
Firstly, although some studies such as Jahan et al. (2025) and Sharma & Midhunchakkaravarthy (2023) applied XAI techniques including LIME and SHAP to provide interpretability, many still treat predictive models as “black boxes”. Interpretability is important for medical practitioners because it can help them discover which features influence predictions the most. By doing so, interpretable results can help improve clinical decision-making.
Secondly, many studies have found limited generalizability. This is because many predictive models have been trained on populations with specific racial or demographic characteristics. In addition, some models have been trained on small or synthetic datasets, such as those from open-access platforms such as Kaggle, which can cause potential overfitting and may result in unstable performance when applied to diverse populations. Hence, to support generalizability, a dataset that is large, real-world, and demographically diverse is important in this study.
Thirdly, this study relied heavily on neuroimaging such as MRI, PET, or CSF biomarkers. Studies such as (Alroobaea et al., 2021) demonstrated good predictive performance using these modalities. Although they provide useful information for detection, they are expensive and often unavailable for low-income to middle-income populations. There is a need for models that utilize easy-to-obtain data such as demographics, clinical history, cognitive assessment results, and lifestyle factors to facilitate cost-effective screening.
Lastly, there is a lack of deployable systems that transform complex algorithms into user-friendly applications, such as in, Nurma Sari et al. (2022) which attempted to develop web-based diagnostic tools. Many studies have typically conducted experimental evaluations, but they rarely deployed accessible tools that can be easily operated by medical practitioners. Thus, a usable software interface is essential for applying predictive capabilities to real-life situations.
Hence, this study aims to address these gaps as much as possible by developing a powerful predictive model integrated into a system that utilizes easy-to-obtain data and provides interpretable XAI features for cognitive decline assessment systems.
The methodology to develop a suitable predictive model and a system for the early detection of cognitive decline is separated into two phases, as shown in Figure 1. In the first phase, the main predictive model was developed. This involves data collection from the NACC repository, data preprocessing, feature engineering, and class-imbalance handling. Several machine learning algorithms, including Random Forest (RF), XGBoost, SVM, and LightGBM, were trained, evaluated, and compared to select the most suitable predictive model for the system. Figure 2 shows the flow of phase 1. The chosen model was subsequently interpreted using SHAP. In the second phase, the best-performing model is integrated into a functional system prototype. It includes the design of the system architecture, software requirements, and a user-friendly interface to allow for practical testing.
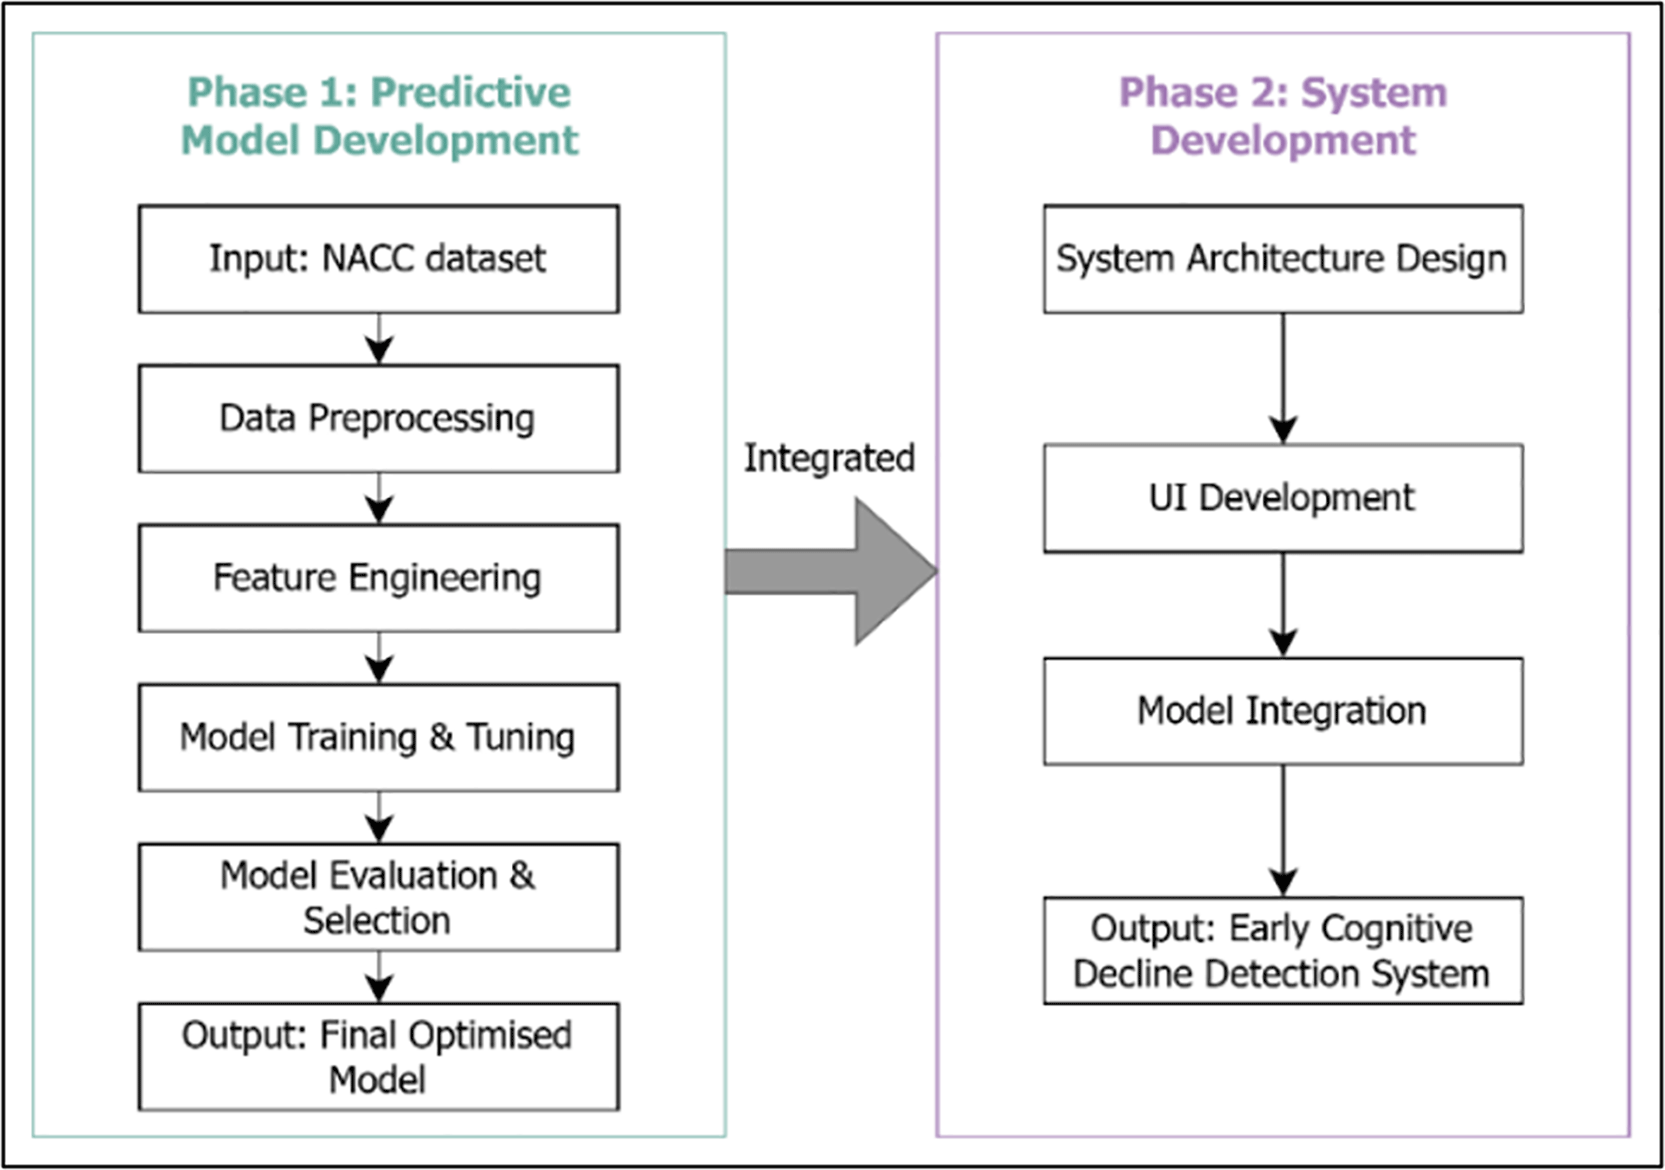
Figure 1 shows the two-phase project connecting Phase 1, Predictive Model Development with Phase 2, System Development.
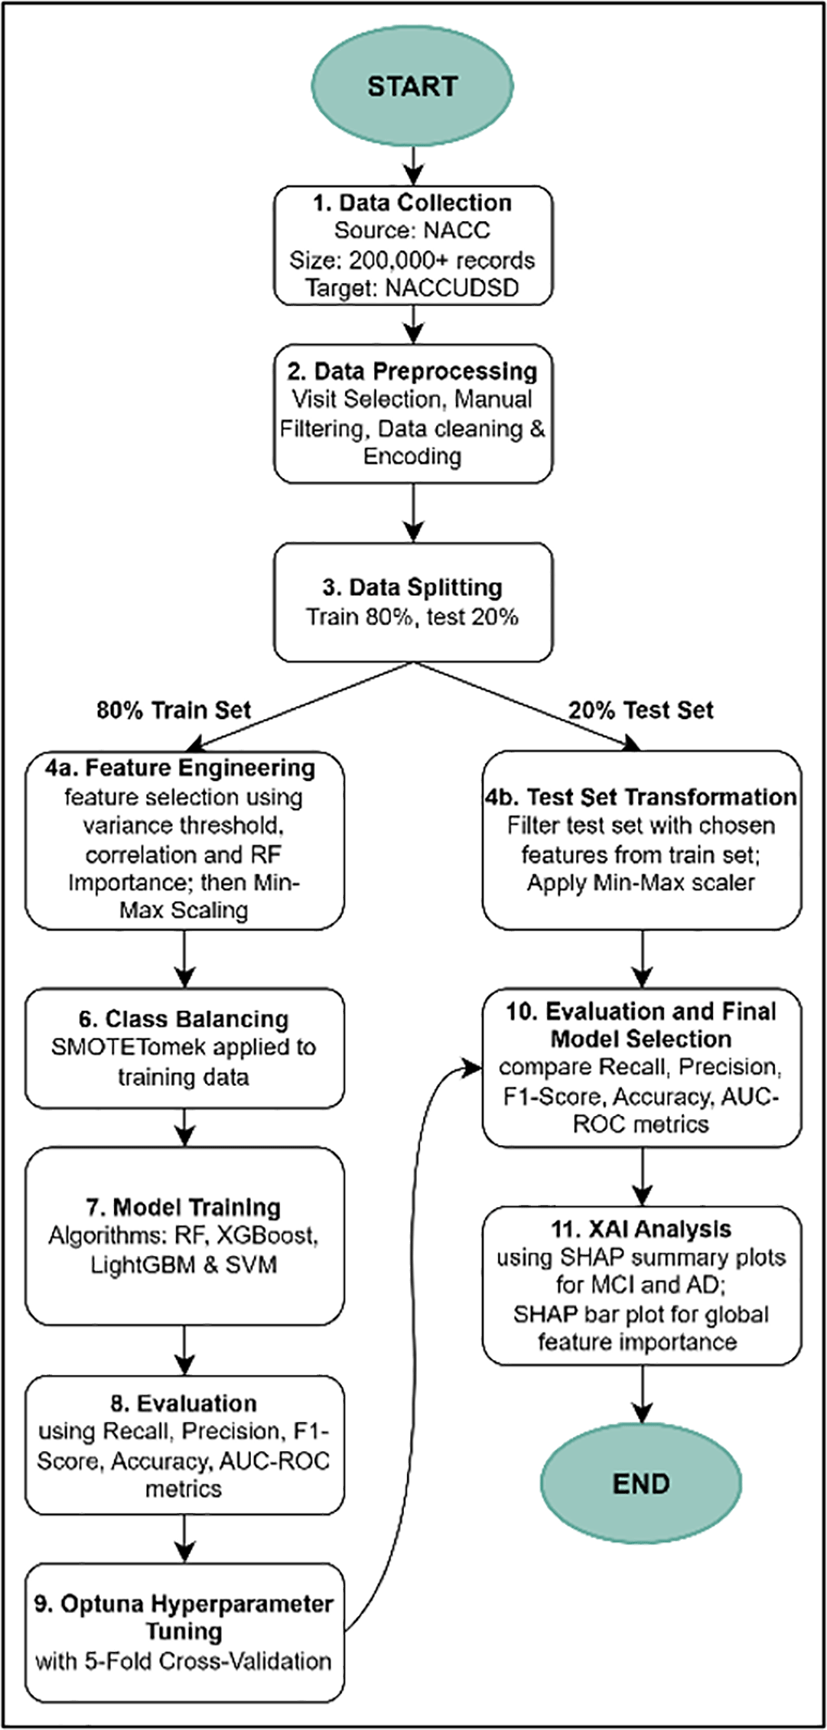
Figure 2 shows a step-by-step processing flowchart carried out in Phase 1 from the initial NACC data collection through data splitting, preprocessing, class balancing, training, optimization, and XAI analysis.
Starting from Phase 1, the dataset used in this study was obtained from the National Alzheimer’s Coordinating Center (NACC), a large longitudinal clinical repository established in 1999. These data include the records of all participants up to the time the data were frozen in September 2025. A dataset was required for this study. It includes three components: uniform dataset (UDS), neuropathology (NP) dataset, and genetic data, and it has 205,908 records and 1024 variables. Table 3 provides a description of the NACC data components.
In this study, UDS and genetic data were utilized because they are clinically relevant and are suitable for early cognitive decline detection, while the neuropathology dataset was excluded due to its unrelated information to this project, which focuses on early cognitive decline detection in living individuals. Although the NACC dataset is longitudinal, this project adopted a cross-sectional design by selecting a single visit per participant to develop an early cognitive decline detection using machine learning models. The target variable was the NACCUDSD, which shows the cognitive status of individuals. Although the original variable had four diagnostic classes, including normal cognition, impaired not-MCI, MCI, and dementia, the Impaired-not-MCI class was removed due to its vagueness. Some studies (Guillén & Frias-Martinez, 2025; Yi et al., 2023) have restricted the classification to Normal Cognition, MCI and AD classes in the target variable. Consequently, individuals were grouped into three distinct classes for this project: Normal Cognition, MCI and AD.
The NACC data are freely available, and users can request the datasets by navigating to the dataset URLs provided in the Data Availability section. Users must submit a brief project proposal and sign the NACC data-use agreement. The NACC repository was updated periodically with new visits and follow-up data. To achieve accurate data replication, the frozen version of September 2025 needs to be used. However, preprocessing, feature engineering, and class balancing steps applied in this study can be followed, as described in the Methods section.
After loading the dataset into the Jupyter Notebook, several data cleaning and preparation operations were executed sequentially before the clinical data could be used to train the machine learning models.
First, the longitudinal records were transformed into a cross-sectional pattern by extracting only the initial baseline visits for every participant and filtering out all subsequent follow-up entries. This can ensure that the models are trained on the earliest clinical diagnosis of every participant.
Next, the features of the neuropathology component and unique identifiers (ID) were removed as they were unrelated and unavailable in early screening. Except for clinical predictors such as cognitive tests and demographics, the variables that contained more than 50% missing values were also dropped to prevent models affected by imputation bias (Guillén & Frias-Martinez, 2025). In addition, owing to the overlapping function between MMSE and MoCA, MMSE features were removed. As shown in some studies, the MoCA is more suitable and sensitive for early detection than the MMSE (De Boer et al., 2025; Ismail et al., 2025).
Furthermore, to prevent redundancy, the feature set was limited to six core assessments, Trail Making Test Part B (Trail B), Multilingual Naming Test (MINT), MoCA, Geriatric Depression Scale (GDS), Functional Activities Questionnaire (FAQ), and Clinical Dementia Rating (CDR), which are used in healthcare studies (Saa et al., 2019; Tsoi et al., 2015; Woods et al., 2015). Some leakage variables, including clinician symptom judgments, overlapping medical history, irrelevant genetic markers, and medication details, were removed to simplify the feature set. Table 4 lists the categories of administrative, overlapping and subjective variables removed from the feature space during the manual filtering process along with the reasons.
Moreover, according to the reviewed studies, AD is a common form of dementia. Therefore, a filter was applied to the target variable to show only dementia cases primarily caused by AD and to exclude dementia cases caused by other diseases. The target variable consists of a vague class: Impaired-not-MCI. To maintain clear diagnostic boundaries, this class was excluded to allow the model to focus on three distinct stages: Normal Cognition, MCI, and AD Dementia, so that the risk of class overlap could be reduced.
There are various codes in the dataset, which are -4, 8, 9, 88, 99, 888, 999, 8888, 9999, and other codes that represent missing, unknown, and unavailable information. To address this, these codes were first swapped for the null values, NaN. Then, null values of continuous and categorical features were filled in using the median and mode respectively (Guillén & Frias-Martinez, 2025; Kavitha et al., 2022).
Finally, the encoding process converts categorical data into a numerical format that can be understood using ML algorithms. The target variable, NACCUDSD, was re-encoded into three classes: 0 for Normal Cognition, 1 for MCI, and 2 for AD dementia. The categorical variables were one-hot encoded to prevent the models from incorrectly assuming that they were mathematically ordered (Guillén & Frias-Martinez, 2025; Shubar et al., 2024).
Even though manual filtering is performed during the data preprocessing steps, there are still many redundant variables. Some studies selected only 20–40 variables from a large dataset (Chowdhury & Turin, 2020; Guillén & Frias-Martinez, 2025; Pang et al., 2023). Therefore, a hybrid selection method was adopted using the variance threshold, Pearson's correlation coefficient, and running RF Importance using the Gini impurity. After the data preprocessing step and before moving to feature selection, the data were split into two sets: 80% was the training set, and the other 20% was the test set. This aligns with the findings of most of the reviewed studies (Guillén & Frias-Martinez, 2025; Kavitha et al., 2022; Wahyudi & Abdulloh, 2025; Zhu et al., 2024).
First, the variance threshold is the baseline feature selection. This removes features whose variance does not meet the threshold. This is because such features provide minimal predictive power and introduce unnecessary noise (Ambarwati & Uyun, 2020). In this project, variables with 99% identical observations were cropped to reduce the dimensionality of the dataset before applying more complex selection methods. The variance of the feature array, Var[X] for binary-encoded variables is calculated as shown in Equation (1).
where p is the probability of the feature having a value of 1, and (1−p) is the probability of the feature having a value of 0(Ambarwati & Uyun, 2020).
Second, Pearson's correlation coefficient, r was used to identify features that were highly correlated with another variable (Farhan AlShammari, 2024; Kavitha et al., 2022). It measures the linear relationship between x and y as shown in Equation (2).
r=∑(x−x¯)(y−y¯)∑(x−x¯)2∑(y−y¯)2
where x¯ and y¯ are the mean values of x and y (Farhan AlShammari, 2024). Highly correlated features have almost the same effect on the dependent variable, which can destabilize the model. Therefore, the variables with lower clinical relevance were excluded.
Next, the importance of RF using Gini impurity was used to rank the remaining features. The RF algorithm can calculate the importance based on the Gini impurity reduction average or the Mean Decrease in Impurity (MDI) attributed to each feature (Kaliappan et al., 2024). The importance score of each feature, Importance(F) is calculated using Equation (3):
Importance(F)=1N∑t=1NImportance(F,t)
where N is the total number of trees and Importance(F,t) is the impurity reduction of feature F within a single tree t (Kaliappan et al., 2024).
Based on these rankings, the top clinical features were evaluated and selected to predict cognitive decline so that the models could be efficiently trained. Once the best feature list was selected, the exact same feature list was applied to both the training and test sets.
Subsequently, feature scaling using min-max scaling was performed on the training set and test set to standardize them (Shubar et al., 2024). This is because these features use different units and ranges. By scaling all numbers from 0 to 1, the models were not biased towards large numbers.
The medical dataset as well as the chosen dataset always has a class imbalance problem. There were fewer MCI cases than others. This imbalance can affect the accuracy of the model and easily cause biases. Therefore, the Synthetic Minority Oversampling technique and Tomek Links (SMOTETomek) hybrid resampling technique were applied on the training set to balance each class to help the models learn to recognize each case more effectively. What it will do is to generate synthetic data for minority classes to balance the distribution, then clean up the Tomek Links, instances pairs in overlapping regions between classes, as demonstrated in the reviewed study of Zhang et al. (2025). It was selected because it typically performs better than SMOTE alone and Tomek Links by removing overlapping points and making clear boundaries between classes (Shabrina Assyifa & Luthfiarta, 2024). The class proportion of the test data remained unchanged so that the final evaluation was based on the real-world ratio.
Four ML algorithms were chosen to train the model and compare, which are Random Forest, XGBoost, LightGBM, and SVM. They were selected because they are fast to train and perform well in the majority of reviewed studies.
RF is one of the most famous bagging ML algorithms that has performed the best in several studies. It consists of many trained decision trees that work together to obtain a random forest. The decision tree included branches, roots, and leaves. The root node is at the top, and the leaf nodes are at the bottom, which indicates the final prediction results. Each tree is trained on different random parts of the features and data. This makes them look differently, and can help the forest to weed out errors and prevent the model from overfitting. Finally, all prediction results are combined, and the final diagnosis is made (Zhu et al., 2024).
XGBoost is a well-known gradient boosting ML algorithm that can handle complex data structures and minimize overfitting problems. Unlike the RF, it builds trees one after another sequentially. Every time a new tree decreases the errors, it is also known as the loss function made by the previous tree until it reaches the most accurate result (Bentéjac et al., 2019).
Similar to XGBoost, LightGBM is a faster and more efficient gradient boosting ML algorithm developed to overcome the efficiency problems of XGBoost. Other tree-based algorithms grow level-by-level and leafwise, which means that the best tree that minimizes the loss function is selected the most. It proves efficient through innovative methods such as histogram-based decision tree learning, gradient-based one-side sampling (GOSS), and exclusive feature bundling (EFB) (Jahan et al., 2025; J. Zhang et al., 2019).
In contrast to ensemble tree-based algorithms, including RF, XGBoost, and LightGBM, SVM is an algorithm that creates a hyperplane or boundary to set apart different classes. It maximizes the distance between the hyperplane and the closest data points or support vectors such that the classification is performed clearly. If the data are not linear, they have a kernel function to convert nonlinear data to linearly separable data (Cervantes et al., 2020).
To ensure the reliability of the results, the training data were split into five parts and cross-validated using 5-fold cross validation, as applied in Zhu et al. (2024) and Alroobaea et al. (2021). Four folds were used for training, and another fold was validated each time. This cycle was repeated five times. This cross-validation process was performed during hyperparameter tuning using the modern Optuna framework. This was performed for every model to determine the most efficient settings for all models in 50 trials. The reason for using this method is that it uses adaptive sampling and can be stopped early using pruning to efficiently find optimal hyperparameters in high-dimensional spaces (Lai et al., 2024; Rimal et al., 2024). It is also more flexible and faster than Grid Search and other Bayesian methods.
The training and test sets were evaluated using several metrics including recall, precision, f1-score, accuracy, specificity, and Area Under the Receiver Operating Characteristic Curve (AUC-ROC). Recall, precision, f1-score, accuracy, and specificity have been used in most reviewed studies to evaluate model performance. The metric equations shown below were obtained from the reviewed studies (Alroobaea et al., 2021; Zhu et al., 2024).
The recall (sensitivity) measures the ability to identify actual positive cases. This was calculated using Equation (4):
Precision measures the accuracy of positive predictions. It is calculated using Equation (5):
F1-score measures the harmonic mean of both the precision and recall. It is calculated using Equation (6):
F1score=2×Precision×RecallPrecision+Recall
Accuracy measures the overall accuracy of the model. It is calculated using Equation (7):
Accuracy=TP+TNTP+TN+FP+FN
Specificity measures the overall correctness of a model in identifying negative cases, which is Normal Cognition. It is calculated using Equation (8):
where TP is the true positive, TN is the true negative, FP is the false positive, and FN is the false negative. TP shows the number of a model that correctly picks out a patient who actually has a specific condition, and TN shows the number of a model that correctly identifies a patient who does not have the condition. FP indicates the number of models that incorrectly predict a condition that the patient does not have, and FN indicates the number of models that fail to pick up a condition that is actually present. These four values are found in the confusion matrix.
The AUC-ROC was used to judge the model's ability to separate the three cognitive classes. As the classification is multiclass, the One-vs-Rest (OvR) approach was carried out. A separate ROC curve was plotted for one class, such as the MCI class, against the other classes using the True Positive Rate (TPR) and False Positive Rate (FPR). A curve that reaches towards the top-left corner of the plot indicates a higher accuracy. A large AUC value indicates good generalizability (Zhu et al., 2024).
After the best final model was chosen by comparing the evaluation metrics, the end process of phase 1, SHAP, was used to break down the “black box” of the best-performing model. Summary plots were used to identify the most important features across the entire dataset. By applying SHAP analysis, as in some of the reviewed studies, the transparency of the model is increased. This indicates whether a specific feature value has a big impact towards a certain class, such as MCI or Dementia. Therefore, XAI-like SHAP is important in prediction because it shows the reasoning behind the prediction, which allows clinicians to look through and understand.
In Phase 2, the system development phase, a prototype system, COGNEUTEST, is designed using a 3-layered architecture to separate the user interface, processing part, and storage. Figure 3 shows three layers and the data flow between the Streamlit user interface (frontend), core Python engine (backend processing and model execution), and local SQLite medical record storage.
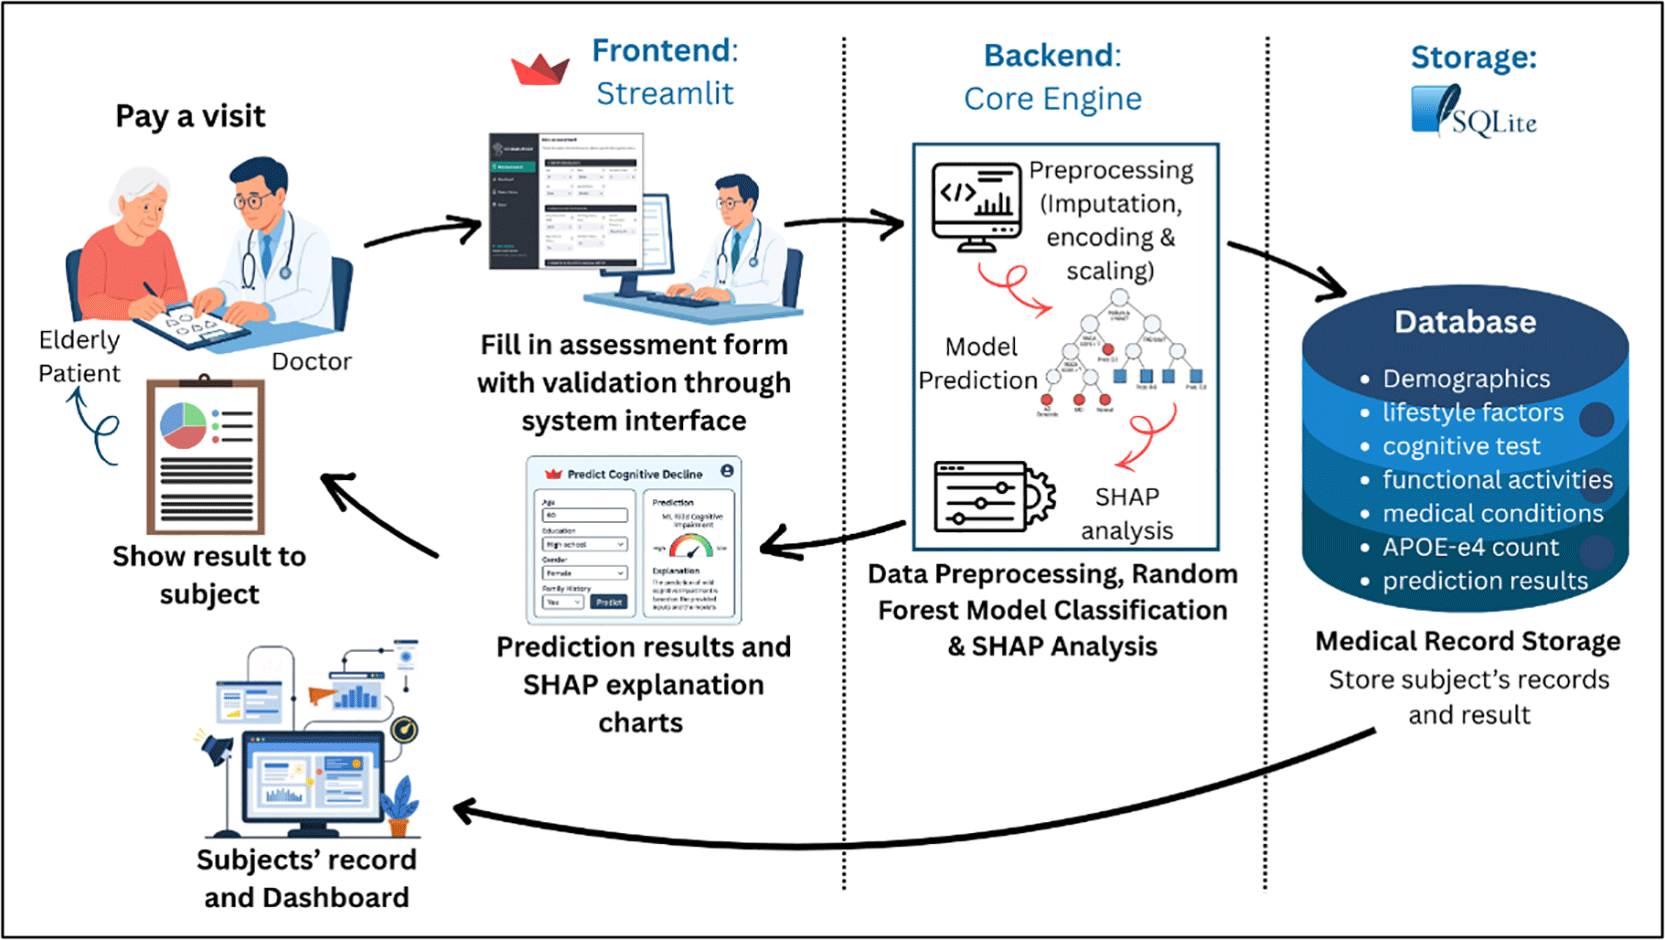
Figure 3 shows three layers and the data flow between the Streamlit user interface (frontend), core Python engine (backend processing and model execution), and local SQLite medical record storage.
In the front-end layer, this website interface was built using the Streamlit framework to provide a web-based interface. It has several input fields corresponding to the selected clinical features, such as cognitive test scores, demographics, medical conditions, and lifestyle factors. This was designed to display the final prediction results using SHAP interpretability charts.
The backend layer represents the engine part, which is written in Python. The backend includes preprocessing steps such as imputation, one-hot encoding for categorical features, and min–max scaling for numbers, as well as the deployed Random Forest model for classification. It took the validated input data from the website and went through these steps, performed cognitive decline predictions, and analyzed the prediction results with SHAP.
The storage layer is where the record was recorded using the SQLite database after the engine completed its task. The saved database included patient demographics, lifestyle factors, cognitive test scores, functional activities, medical conditions, APOE-e4 allele counts, final prediction outputs, clinical reports, and timestamps. This local database allows medical practitioners to query past patient records.
To ensure that the system functioned smoothly, a specific step-by-step flow was performed. Figure 4 shows the activity diagram.
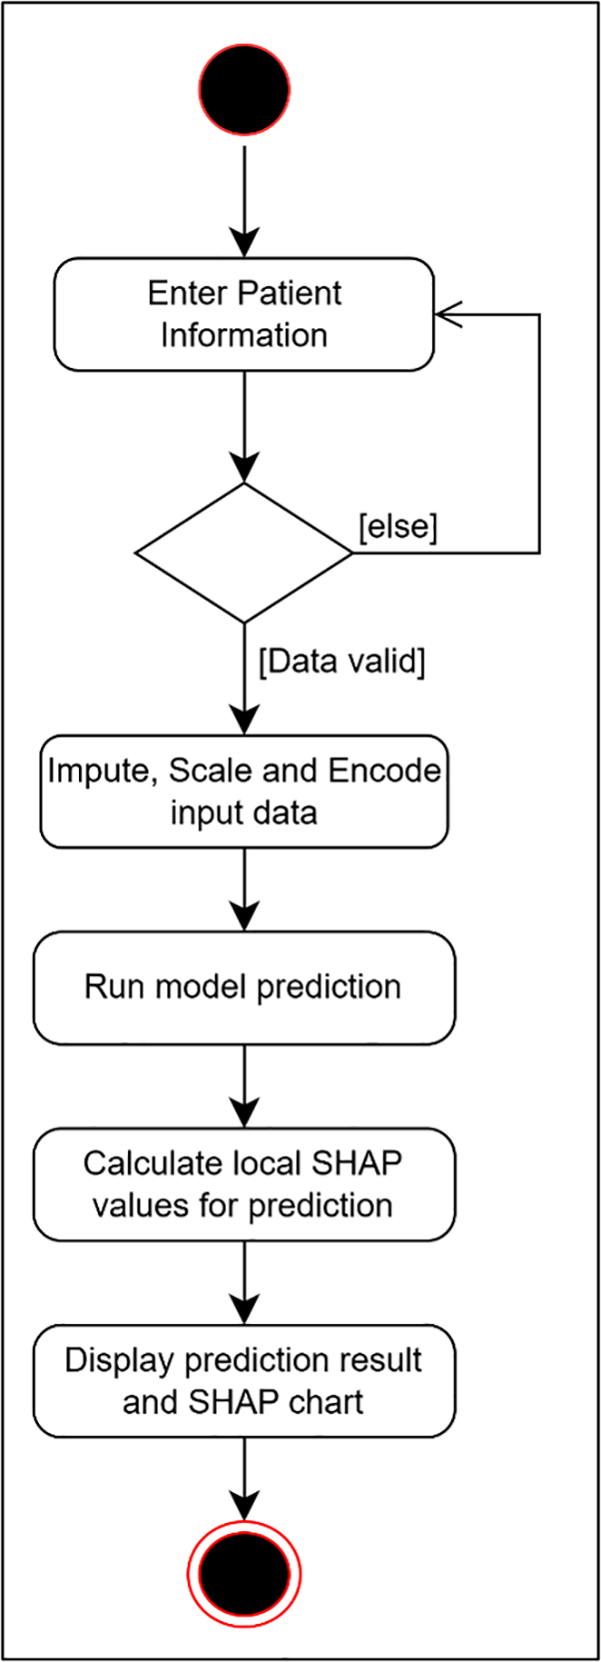
Figure 4 shows an activity diagram listing the logical steps executed by the system when a user inputs patient data and requests a prediction.
The process begins when medical practitioners enter patient clinical data into the system. A data validation check was performed to ensure that all the fields were in the correct format. Then, it was automatically imputed, scaled, and encoded using the same method applied during the model training phase.
Subsequently, the processed data were passed to the trained predictive model to generate a classification result. It identifies the patient as having Normal Cognition, MCI or AD Dementia. In addition to the final prediction, the system performs a SHAP analysis to identify and visualize the clinical factors that contributed most to the prediction.
The experiment and development were performed on a local laptop. The laptop was equipped with 16GB of DDR4 RAM to manage the large data structures and model training. An NVIDIA GeForce GPU is also available to support faster computations during model training and evaluation. Using a local development environment provides better stability and faster iterations than cloud-based environments with shared computational resources.
Integrated development environment (IDE) Visual Studio Code (VS Code) is suitable application to be used as the main workplace for developing the predictive models and the system. It was chosen because it can install various extensions, including Jupyter, and Python provides an environment for writing and executing Python code in a notebook format. This setup enabled the efficient execution of data preprocessing, model training, tuning, evaluation, and visualization within a single development environment. The Python version used in this study was Python 3.14.2.
The experiments were performed on a Windows operating system that supported all the tools and libraries used in this project. The entire project was built using Python programming language. This is because it is a widely used language that can create predictive models with the libraries required for data preprocessing, model training, tuning, evaluation, and system development.
Several Python libraries are used in this study. First, Pandas and NumPy were used to clean the data and perform preprocessing. Second, Scikit-learn was used to run the core machine learning algorithms, including Random Forest and SVM, as well as for preprocessing methods, including min-max scaling and evaluation. The XGBoost and LightGBM libraries were also imported. Third, imbalanced learning was used to address class imbalance issues in the dataset using SMOTETomek. Fourth, Optuna was integrated to perform hyperparameter tuning for all the four algorithms. Finally, the SHAP library was integrated to break down the model's logic and provide explainable results using visuals.
Other Python libraries were used for the system development phase. Joblib was used to save and load the required files to be used in the system. The Sqlite3 library was integrated to save the patient records. Xhtml2pdf and Base64 libraries were used to translate HTML content and images into a PDF clinical summary report. The UUID and Pytz libraries were used to auto-generate unique reference tokens for records and track timestamps in the Asia/Kuala_Lumpur time zone. In addition, The Streamlit framework version 1.56.0 was used to set up the web-based interface during the system development phase. This allows the creation of a user-friendly interface where clinical data can be input to receive prediction results. Visual Studio Code was used to write and test the application code to link the best model and system.
The NACC dataset contained complex, noisy and longitudinal data. To prepare this dataset for machine learning analysis, several preprocessing steps were performed to transform the high-dimensional and noisy raw NACC dataset into a structured format. The feature space was then reduced from 1,024 variables to 456 columns through manual filtering to eliminate administrative headers, post-mortem neuropathology autopsies, target-leaking variables, and other less important variables. After that, the missing codes were replaced with null values, NaN, and then imputed using feature medians for continuous variables and modes for categorical variables. Columns exhibiting more than 50% missing data fields were discarded, except for the critical NACCMOCA variable, where records lacking the screening score were entirely dropped. Following the one-hot encoding of categorical dimensions, the fully cleaned cross-sectional dataset comprised 18,245 unique subjects and 212 encoded feature attributes. The results of each preprocessing step are shown in Table 5.
The cleaned dataset was split into an 80% training set (n = 14,596) and a 20% testing set (n = 3,649), with uniform stratification across the target diagnostics. To achieve optimal feature reduction, a three-step hybrid selection process is executed solely on the training partition.
In Step 1, variance thresholding filtered out columns where over 99% of the observations were identical (p > 0.99), successfully compressing the feature reduced from 211 to 125 variables.
In Step 2, the Pearson correlation coefficient eliminated multicollinearity by removing the lower-ranked variable from any feature pair showing a correlation score greater than 0.90 (r > 0.90), leaving 121 remaining features.
In Step 3, a Random Forest Gini impurity importance ranking is applied to the remaining feature space, accumulating encoded dimensions back into their parent variables to determine the top 30 predictors, as shown in Figure 5.
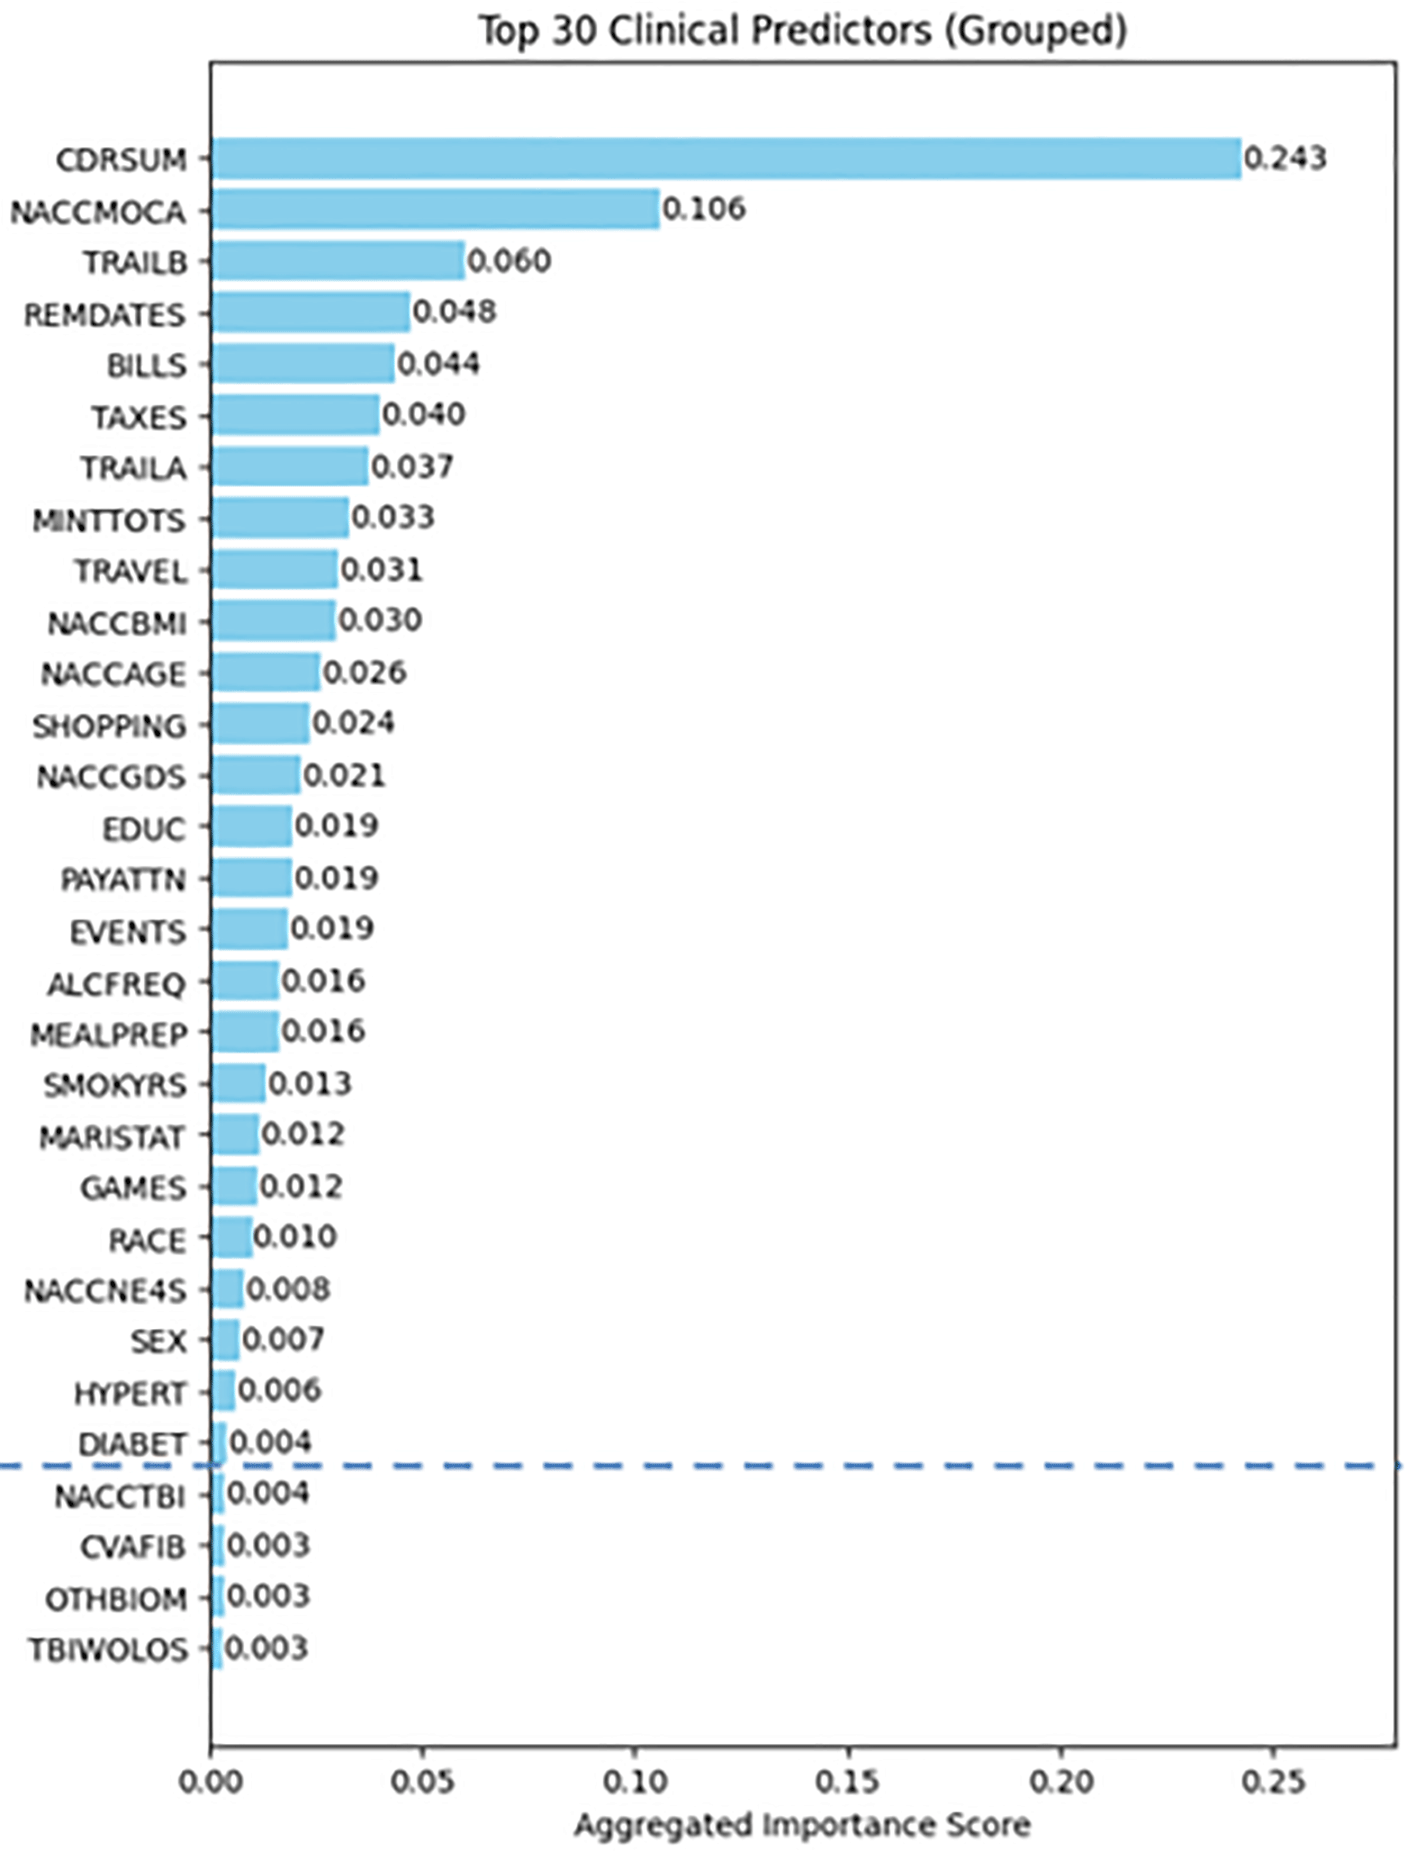
Figure 5 displays the Mean Decrease in Impurity (MDI) scores for the top 30 clinical variables and highlights the feature selection cut-off line for diabetes.
Features with an importance value above 0.005 were maintained, and a cutoff was created at the diabetes variable (DIABET). This cut-off point was chosen to eliminate weak or unusable data. Stopping right at DIABET allowed the model to drop weak noise and maintain useful health conditions, such as diabetes and high blood pressure. This process produced a final set of the top 26 core clinical features, as shown in Table 6.
After selecting the 26 base features and extracting their corresponding 55 encoded variables, min–max scaling was applied to normalize the range of independent variables to a uniform range of 0 to 1.
To fix the class imbalance problem, SMOTETomek resampling was applied to the training set, generating synthetic profiles for minority classes and removing overlapping Tomek link pairs along class boundaries. This generated a balanced training set consisting of 7,574 normal, 7,570 MCI, and 7,852 AD records, whereas the test set was unchanged to evaluate the model performance against real-world clinical distributions.
Four machine-learning algorithms, Random Forest, XGBoost, LightGBM, and SVM, were trained and evaluated. The performance of each classifier was assessed using various performance metrics, including the Accuracy, Recall, Precision, F1-score, Specificity and AUC value. Hyperparameter tuning was conducted using Optuna to investigate whether model optimization could improve the models. Table 7 presents the comparative results of the ML classifiers before and after hyperparameter tuning using Optuna.
As observed in Table 7, the tree-based ensemble models Random Forest, LightGBM, and XGBoost demonstrated good performance and high stability on the test set because the accuracies were above 0.85, and AUC values exceeded 0.95. This demonstrates that ensemble learning methods are suitable for complex classification in early cognitive decline detection.
Among these models, Random Forest has the highest accuracy at 0.8605. It has the most stable performance across all evaluation metrics, especially in terms of both AUC and specificity, which reached 0.9534 and 0.9286, respectively, after tuning. This means that random forests have stronger generalizability and better discrimination ability, which is important in clinical detection systems.
Although LightGBM achieved a good macro precision of 0.8402 after hyperparameter tuning, its AUC slightly decreased from 0.9530 to 0.9519 compared with the result before tuning. This means that although LightGBM predicted more cases correctly, its ability to distinguish between classes did not improve.
XGBoost also showed good performance, particularly before tuning, with an AUC of 0.9539. However, similar to LightGBM, the improvement after tuning was minimal and did not perform better than Random Forest.
However, SVM performed the worst when compared to the ensemble models. Although SVM showed reasonable baseline performance, hyperparameter tuning led to a decline across all metrics, suggesting that SVM is less robust to class imbalance and high-dimensional features in this dataset.
Hence, Random Forest was selected as the final predictive model for further analysis and interpretation because it showed the most consistent, best, and stable performance across all evaluation metrics compared to others. The optimal Random Forest configuration was selected during Optuna hyperparameter tuning with 5-fold stratified cross-validation of the training data. The average AUC across the folds was used for evaluation. The final hyperparameter settings are summarized in Table 8.
The detailed performance of the tuned Random Forest model is illustrated in the One-vs-Rest ROC curves, as shown in Figure 6 From the figure, where it can be seen that the model exhibits exceptional discriminative ability for the AD Dementia class, which is indicated by a red line. It achieved an AUC of 0.9792. Similarly, the Normal Cognition class, which is shown with a green line, had a high AUC value of 0.9681. The MCI class, which is shown with an orange line, presented a slightly lower AUC of 0.9130. This is expected in clinical research, because MCI has overlapping features with both normal aging and dementia.
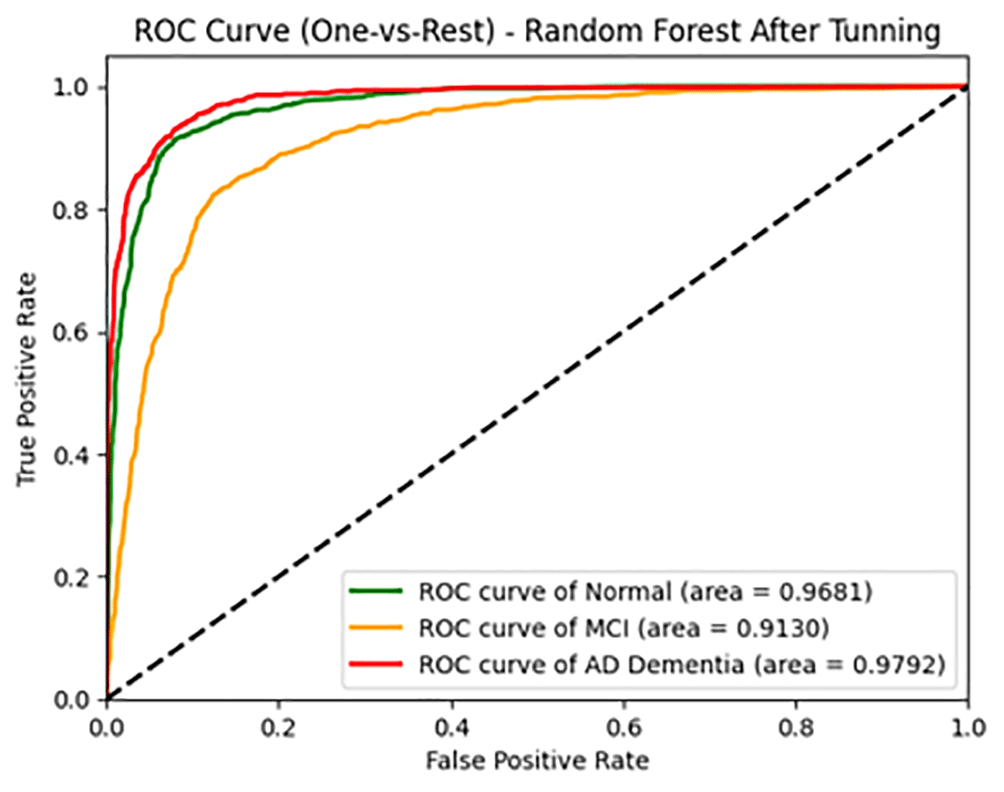
Figure 6 presents a multiclass Receiver Operating Characteristic plot displaying the individual area under the curve metrics for the Normal, MCI and AD Dementia classes using the One-vs-Rest strategy.
A confusion matrix of the tuned Random Forest classifier on the test set is presented in Figure 7 to further analyze the classification behavior of the Random Forest model. The model minimized severe misclassification, as only two healthy individuals were incorrectly predicted as having AD Dementia, and four dementia patients were missed and classified as normal. The majority of classification errors tend to be MCI class which 115 cases were misclassified as “Normal.” This is an expected challenge in cognitive decline studies because MCI shares overlapping clinical characteristics with normal aging and dementia.
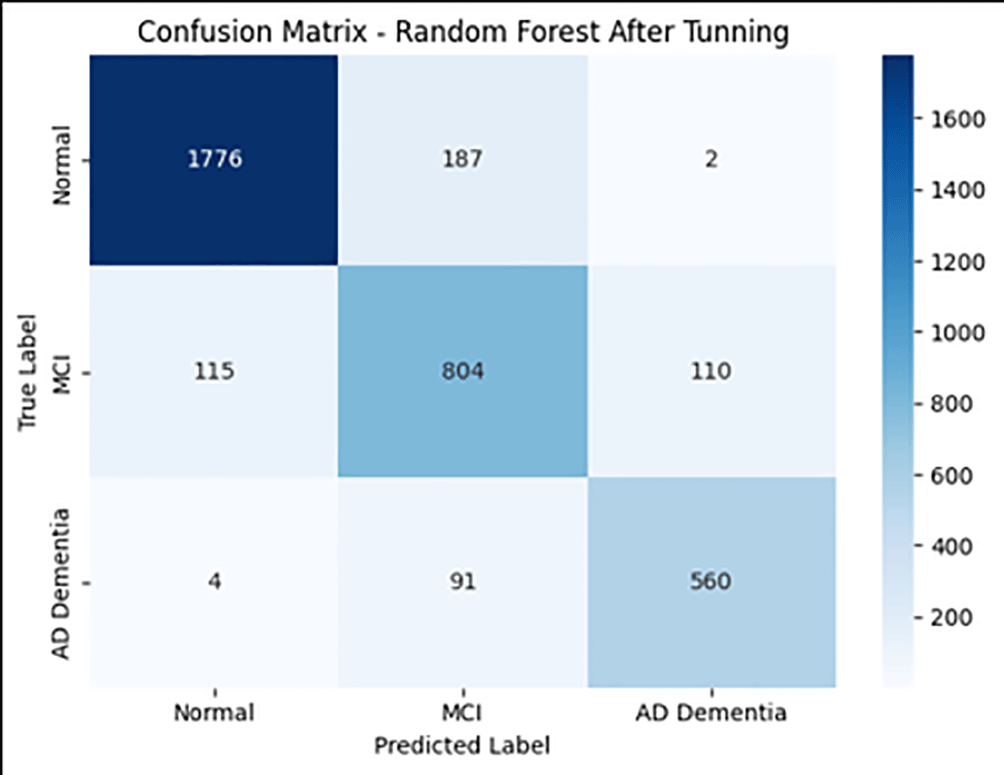
Figure 7 shows a classification matrix that maps the true labels against the predicted labels on the testing set to show the exact true positive, true negative, false positive, and false negative total counts.
A SHAP analysis was conducted. SHAP helps interpret the contribution of each feature to the Random Forest model’s prediction output. It also provides insights into the clinical factors that influence early cognitive decline prediction. SHAP Summary Plots were generated for specific MCI and AD classes. Figure 8 illustrates the effect of 30 features on predicting AD dementia, and Figure 9 shows the effect of 30 features on predicting MCI. Each dot represents a patient and the color indicates the feature value, where red is a high score and blue is a low score. The wider the spread of the SHAP values, the greater the influence of the feature on the prediction.
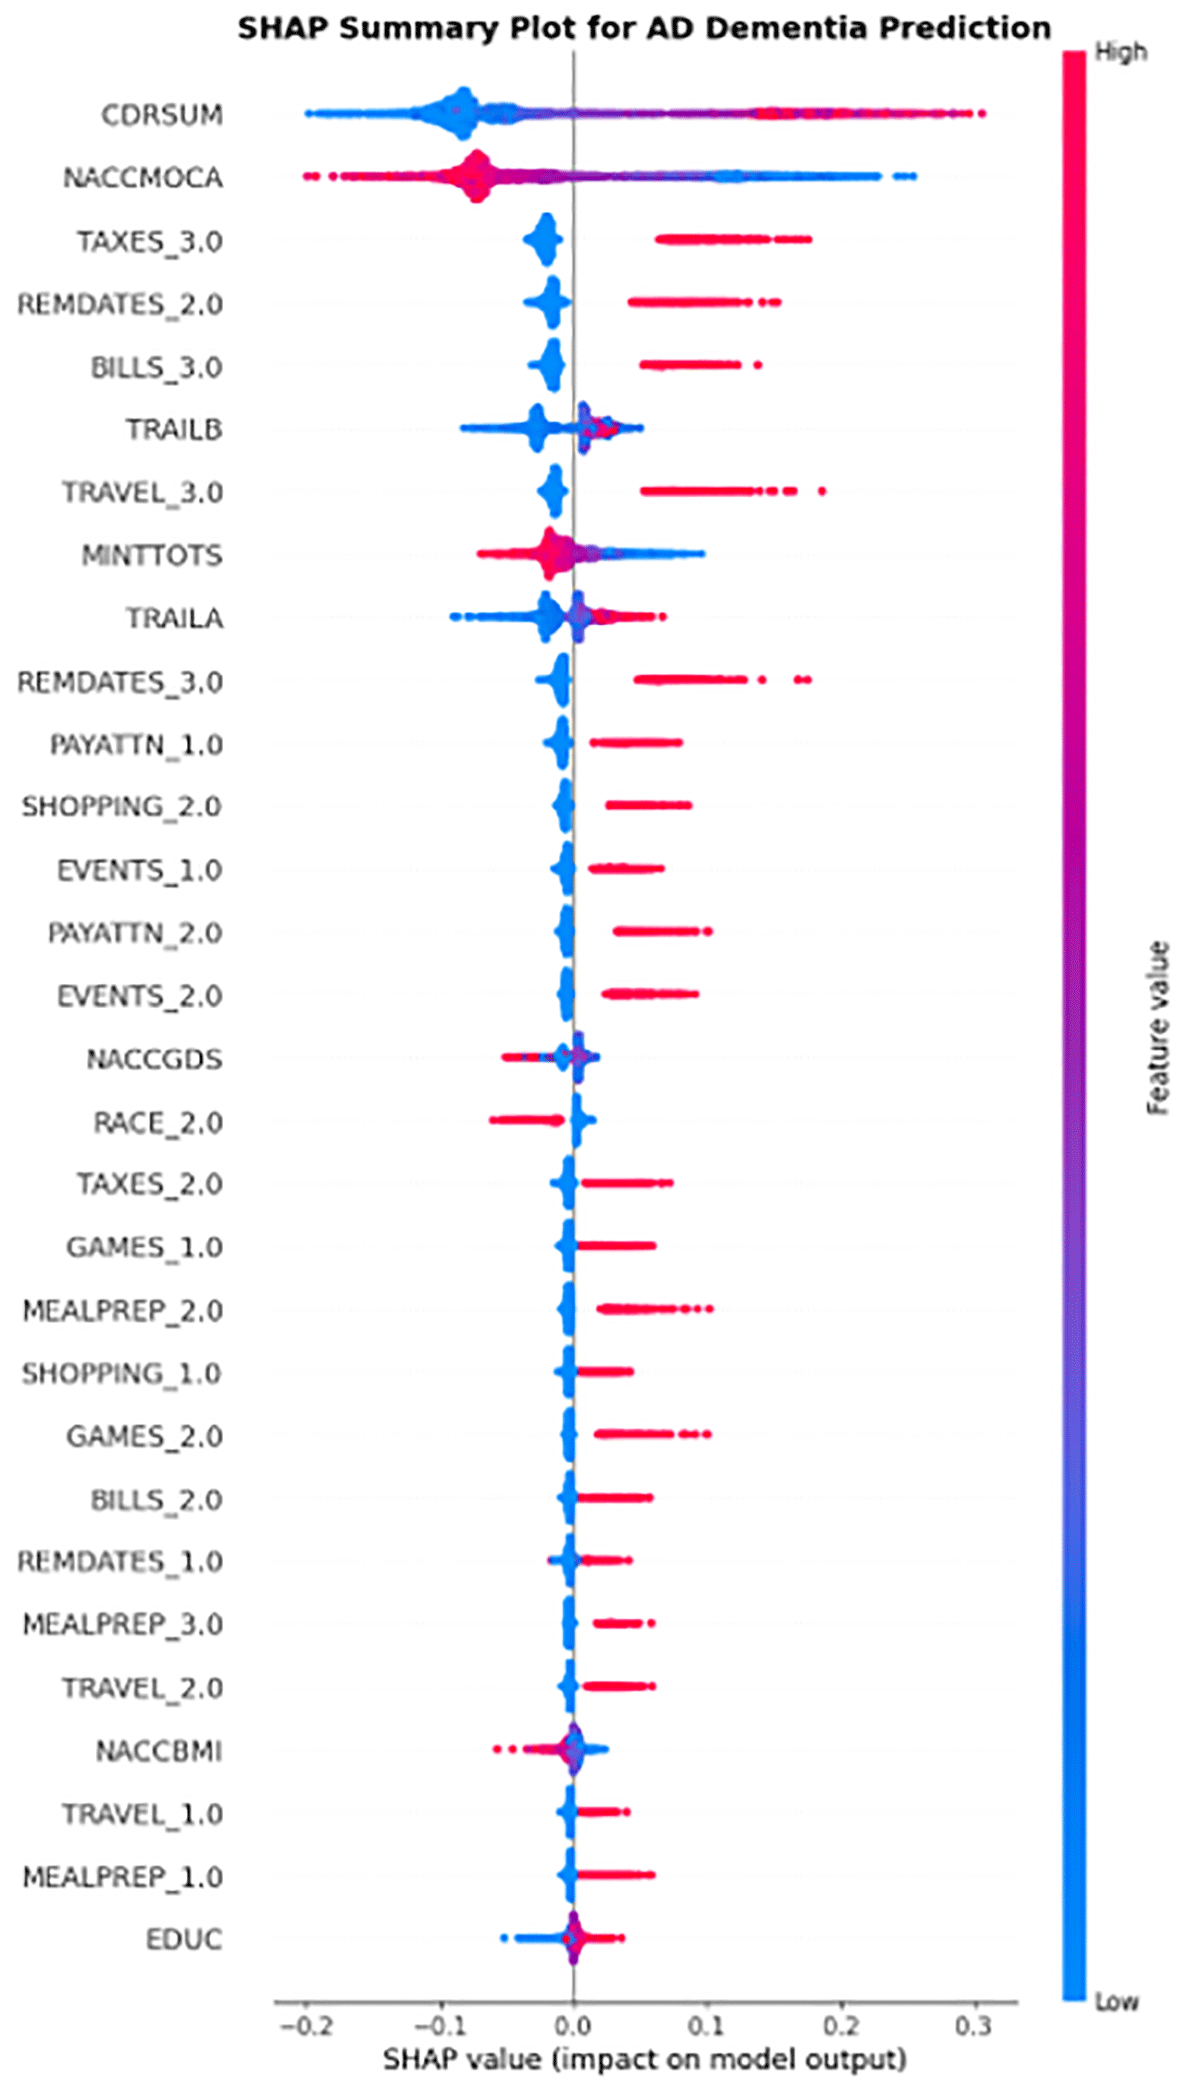
Figure 8 is a summary plot illustrating the global feature importance distribution and the impact of clinical variables on the AD Dementia prediction class.
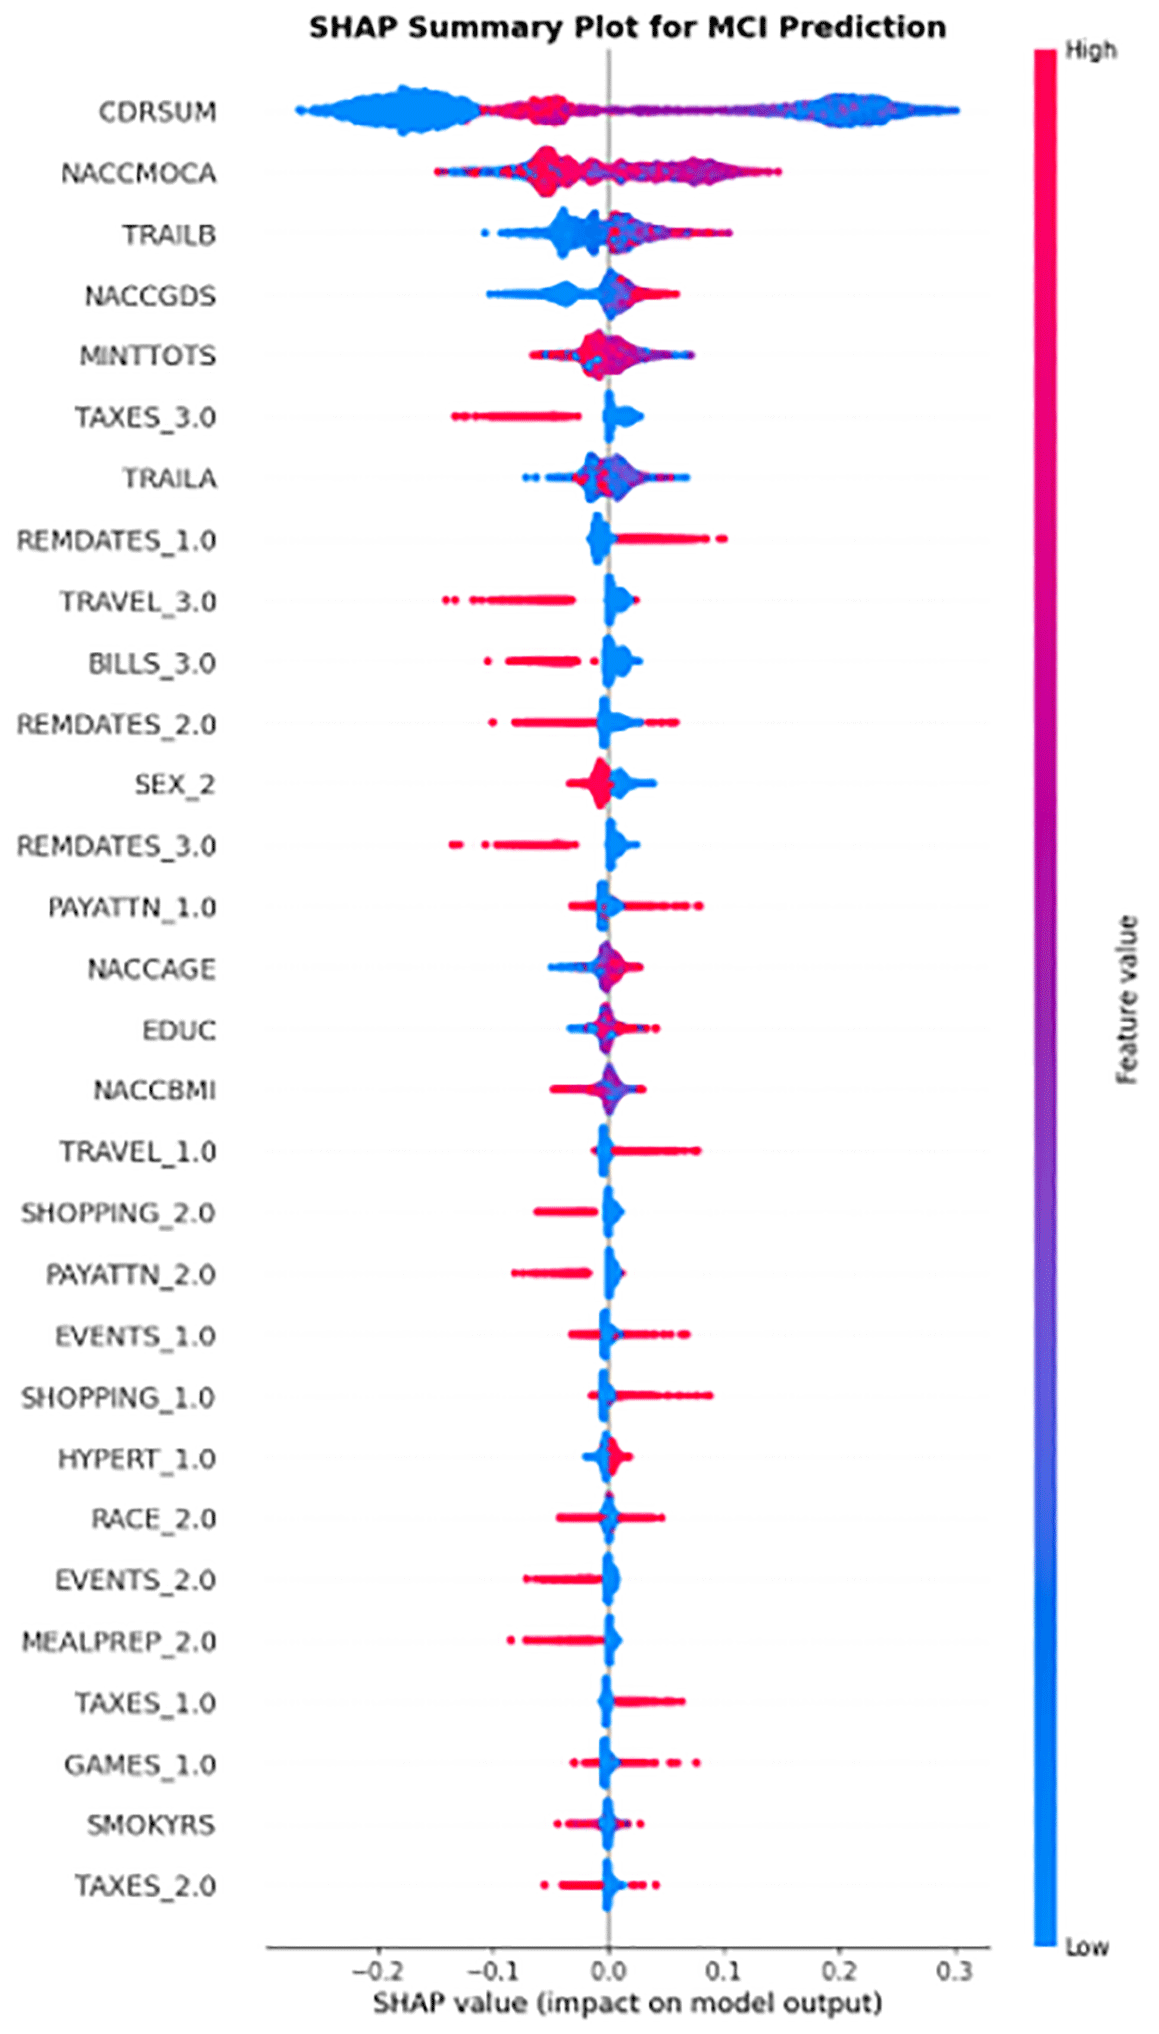
Figure 9 is a summary plot illustrating the global feature importance distribution and impact of clinical variables on the Mild Cognitive Impairment prediction class.
The AD Dementia class summary plot in Figure 8 shows that higher CDRSUM scores are more likely to indicate AD dementia. Conversely, NACCMOCA provides a clear inverse relationship, in which lower test scores drive the prediction towards AD Dementia classification. Other cognitive task features, such as TRAILA, TRAILB, and MINTTOTS, also contribute to AD dementia. For both the Trail Making Tests, longer completion times showed slower cognitive processing. Therefore, both TRAILA and TRAILB have red dots on the right side, and lower MINT test scores with red dots on the left side tend to push towards AD dementia classification. This indicates that difficulties in executive function, attention, and language are commonly impaired in patients with AD. Functional limitations in daily tasks, such as an inability to manage taxes (TAXES_3.0), calculating bills (BILLS_3.0), and recall appointments (REMDATES_2.0), show high positive feature attribution weights, validating that the loss of daily functional independence is a major predictor of advanced neurodegeneration. Demographic features such as education, BMI, race, and genetic variables (NACCNE4S) show low global impact, as cognitive and functional assessments drive the model's diagnostic logic.
On the other hand, in the MCI class summary plot shown in Figure 9, mid-range feature values show a positive SHAP impact to drive the model towards MCI diagnosis. This shows that the model successfully isolates MCI as a moderate state of clinical impairment, clearly distinguishing it from both a normal status and AD dementia. Slower executive processing times on the Trail Making Test B (TRAILB) and mild dependencies on functional activity questionnaire variables increased the likelihood of MCI classification. The MINT total score has higher values on the middle to slightly left side, meaning that lower naming scores increase MCI risk, but the impact is less severe than in the dementia class. Interestingly, high depression scores on the Geriatric Depression Scale (NACCGDS) showed a strong direct correlation with MCI risk, proving that early psychiatric symptoms are important markers for detecting early stage cognitive decline. Demographic characteristics such as sex, BMI, age, and education level play a slightly larger role in the MCI plot than in the AD dementia plot. They showed relatively small effects and did not strongly affect the model’s predictions.
The developed COGNEUTEST system was implemented using the Streamlit framework. The backend acts as the main engine where user data are collected, cleaned, and passed to the machine-learning model to obtain a prediction result. Five useful files were saved using Python’s Joblib library in order to move the processing steps into the system. Table 9 presents the description of each saved file.
When a clinician enters a subject’s details and clicks the submission button, the system processes the data using the following steps:
First, the text options from the dropdown menus, such as Sex, Race, Marital Status and Diabetes history, were converted into their corresponding codes. If a clinician makes sure to leave a field empty or clicks the “Unknown” option, the script automatically assigns it a null value, so it does not throw any errors. Next, the data are passed through imputer_value.pkl to fill in any empty field using the median for numbers or mode for categories calculated from the original dataset used to train the models. Once the data are completely filled, the categorical variables will be processed through onehot_encoder.pkl so that columns such as Sex or Diabetes will be separated into binary one-hot encoded variables such as SEX into SEX_1 and SEX_2 so that they match the training structure. Next, continuous numerical variables such as age, BMI, and years of education were normalized using minmax_scaler.pkl, so they are all between 0 and 1 and prevent giant numbers accidentally tricking the model’s logic. Finally, the processed data were sent to the Random Forest model to calculate the probability for three cognitive classes: Normal, MCI or AD Dementia. Simultaneously, the system uses SHAP’s TreeExplainer to determine which specific variables dragged the subject status to the exact prediction result.
The user interface of the system was built with Streamlit interface components to provide user-friendly navigation for medical practitioners. The system architecture used a clean sidebar menu to navigate four pages.
The Risk Assessment page is the main data entry page, where clinicians can input patient information for evaluation, as shown in Figure 10. To reduce cognitive load, the input fields were structurally grouped into five distinct, clean cards using custom HTML and CSS styling, including Patient Demographics, Medical and Lifestyle History, Cognitive and Neuropsychological Battery, Functional Activities Questionnaire (FAQ), and Genetic Profile. Once the clinician clicks the “Run Prediction” button, the system shows the classification output, SHAP visual, and insights, as shown in Figure 11. Clinicians can download clinical reports of the particular assessment record, as shown in Figure 12.
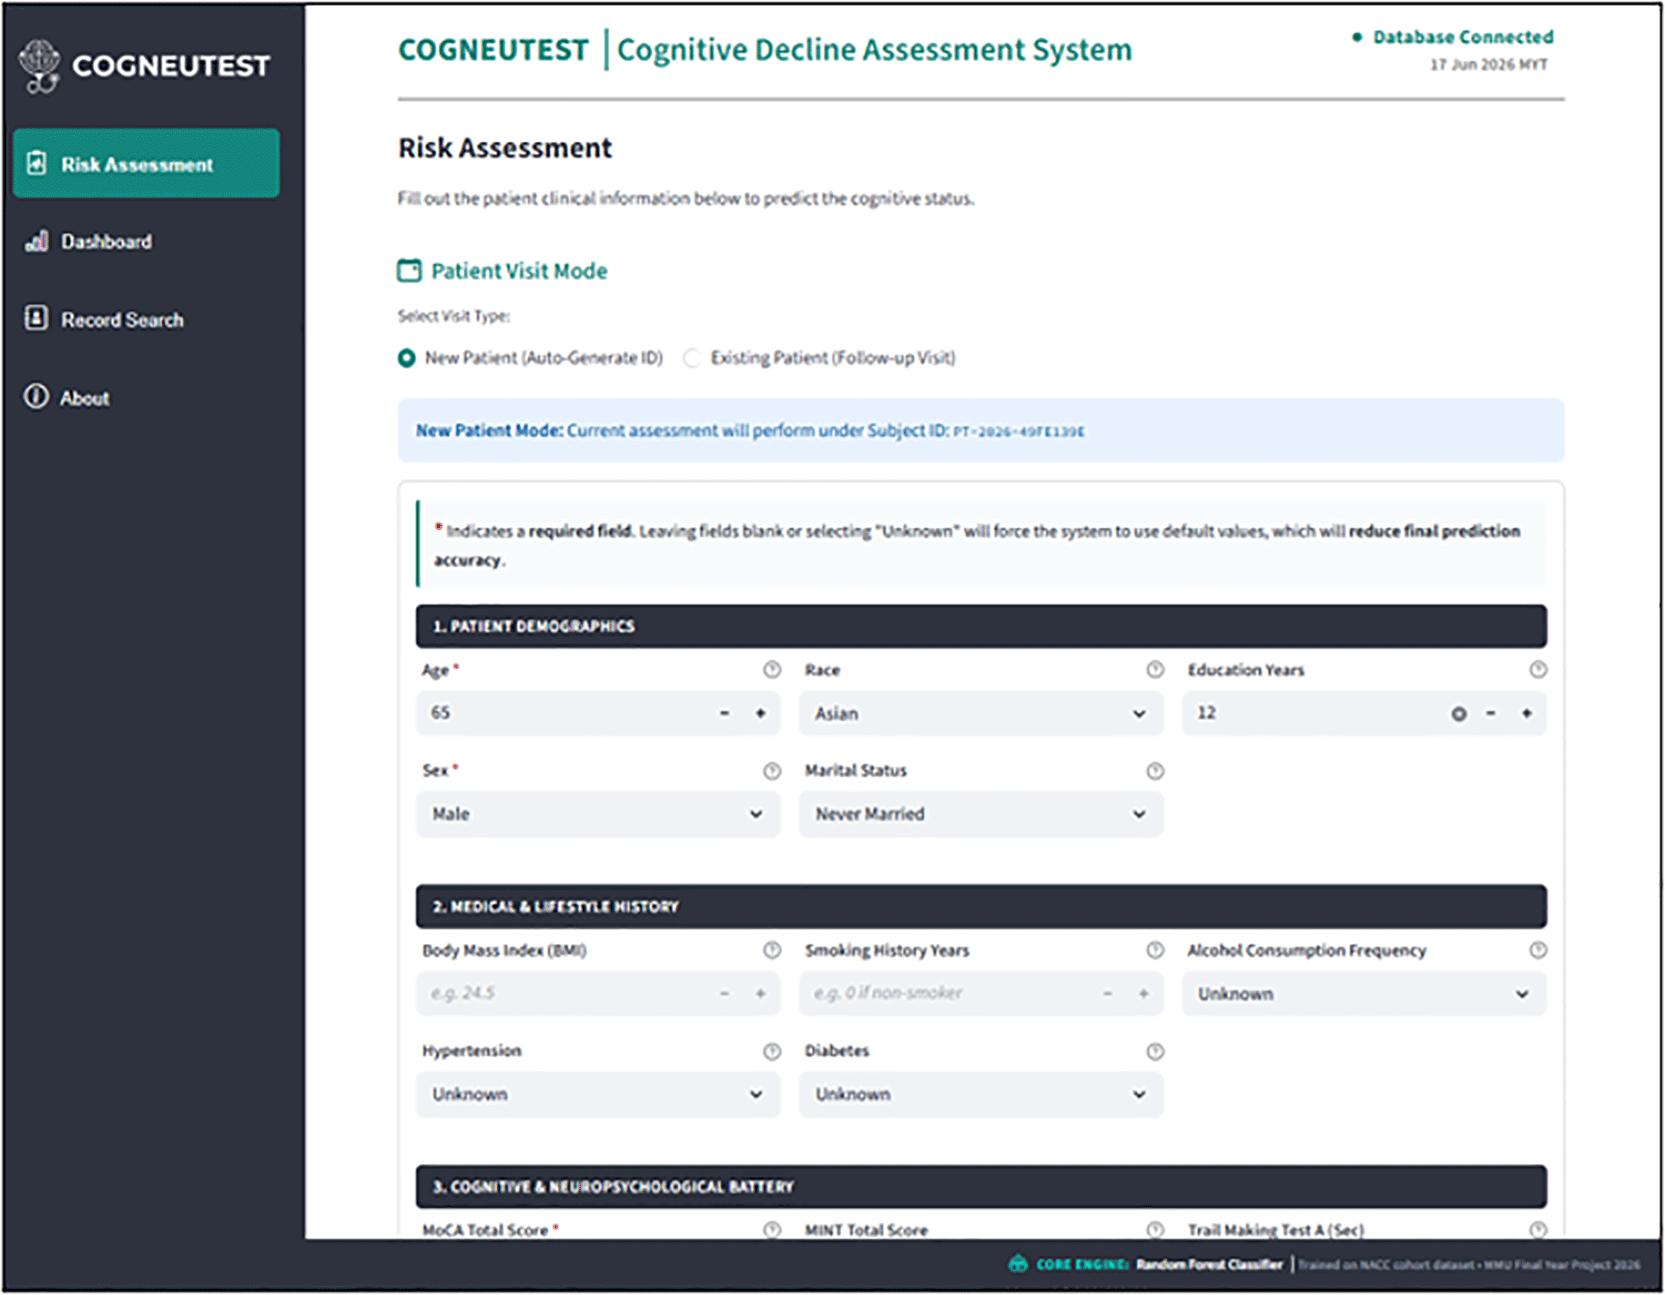
Figure 10 shows a screenshot of the primary risk assessment page, showing the input categories for demographics, history, cognitive tests, and functional variables.
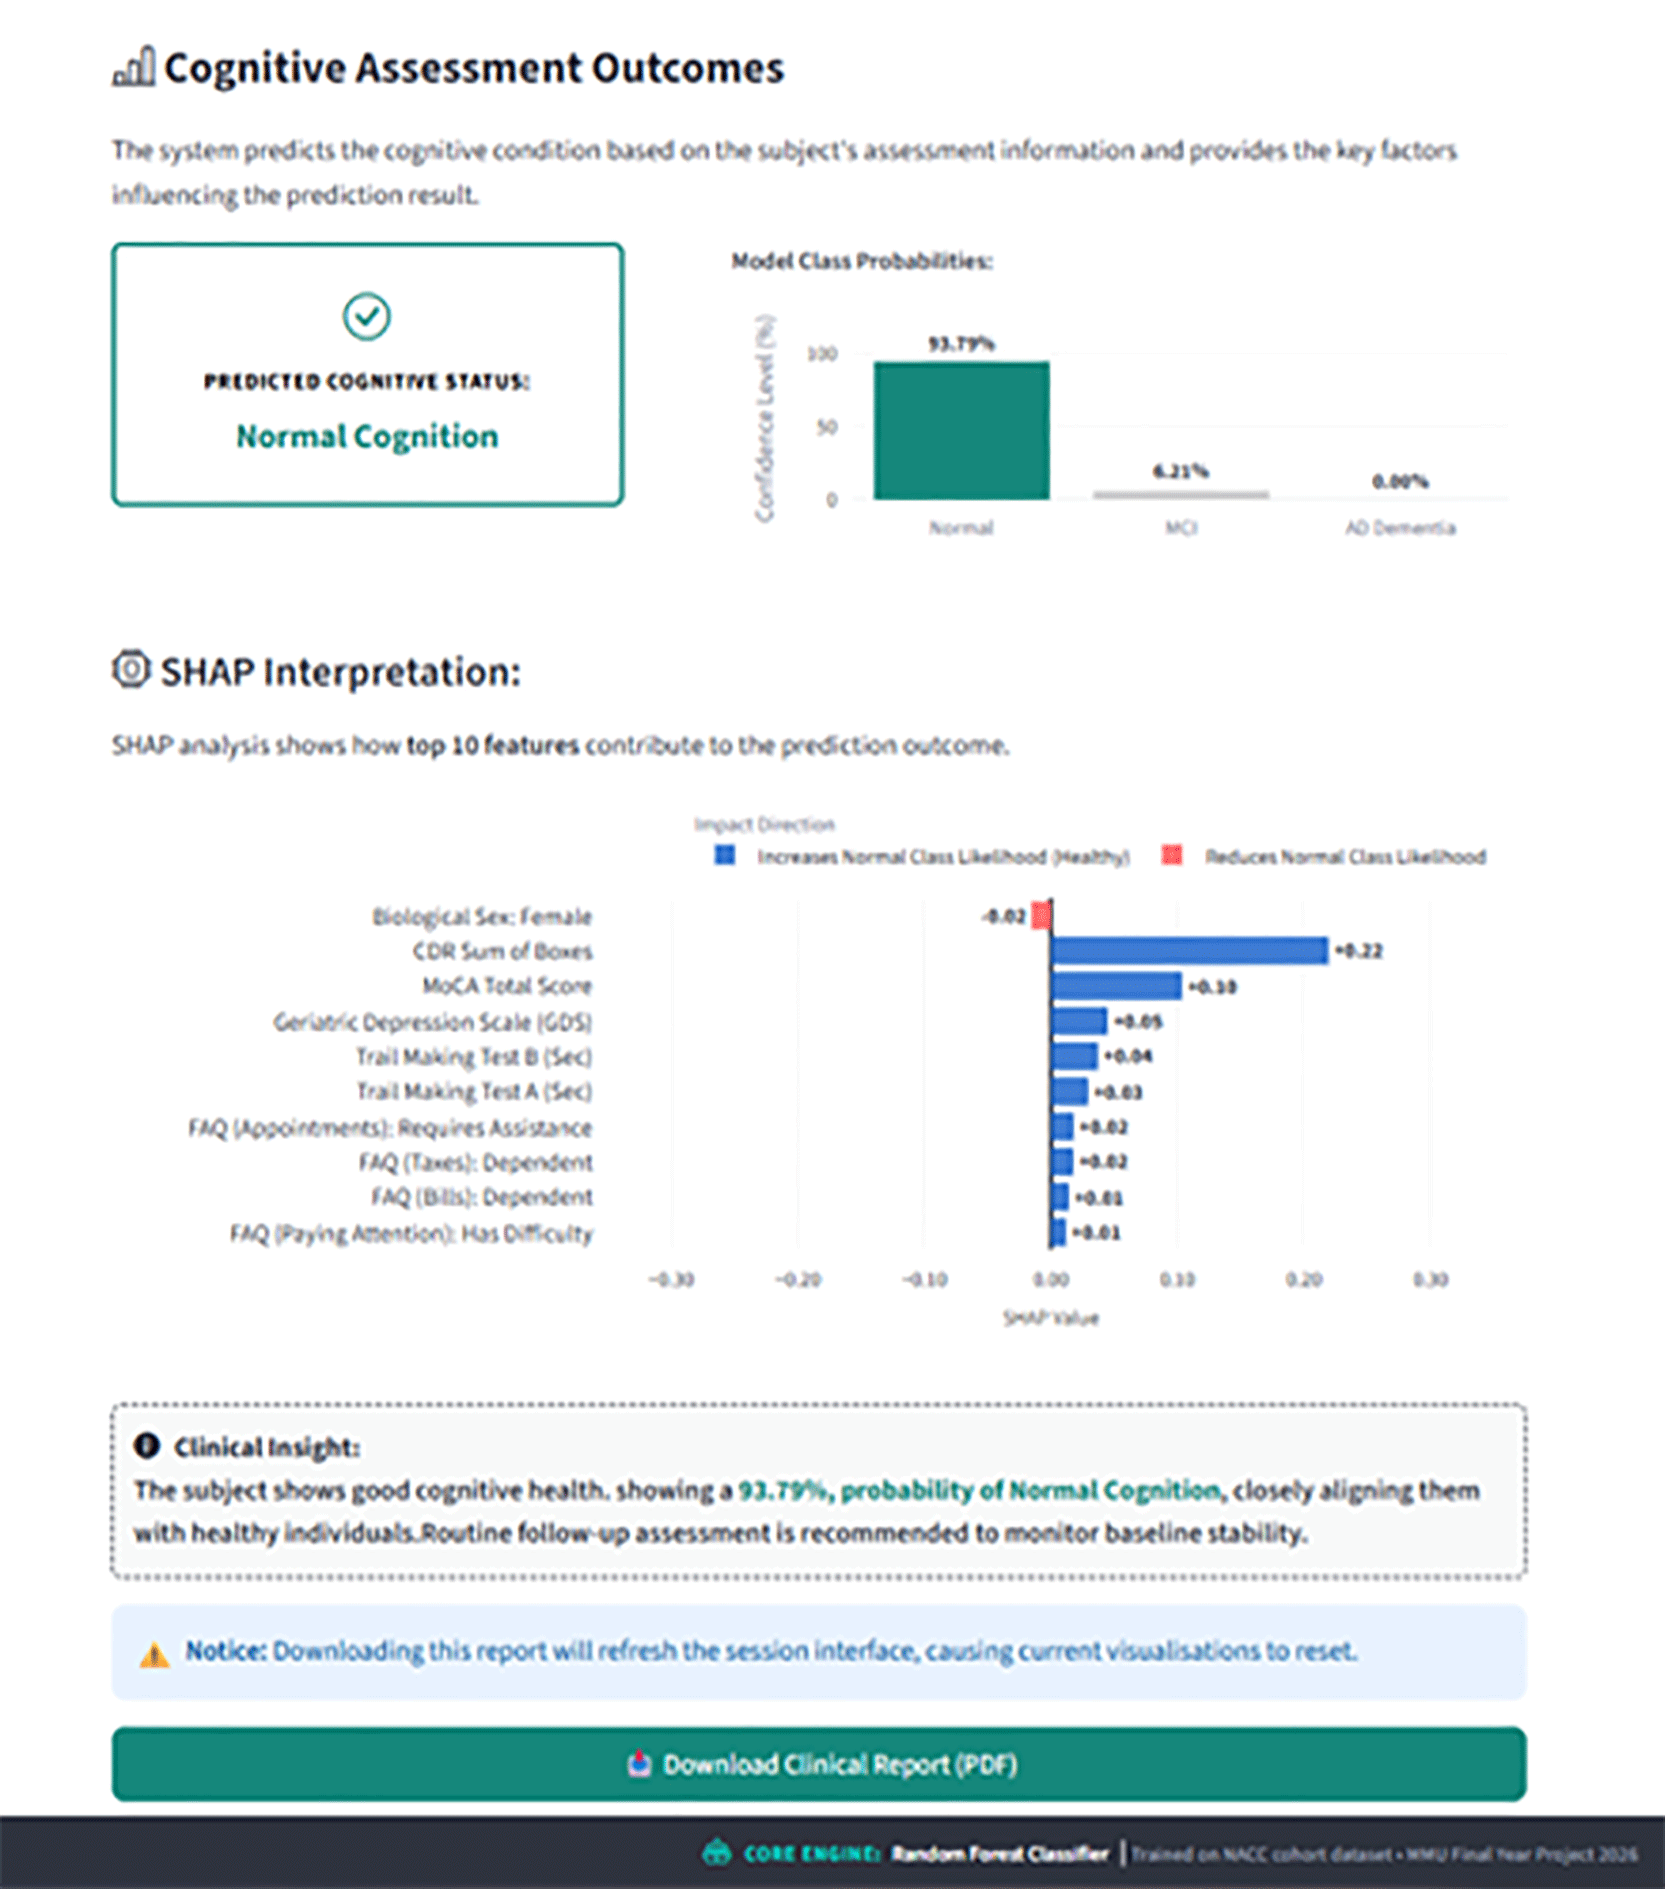
Figure 11 shows a screenshot displaying the diagnostic output section on the risk assessment page, including the class probability chart, SHAP contribution chart, and clinical insight sections.
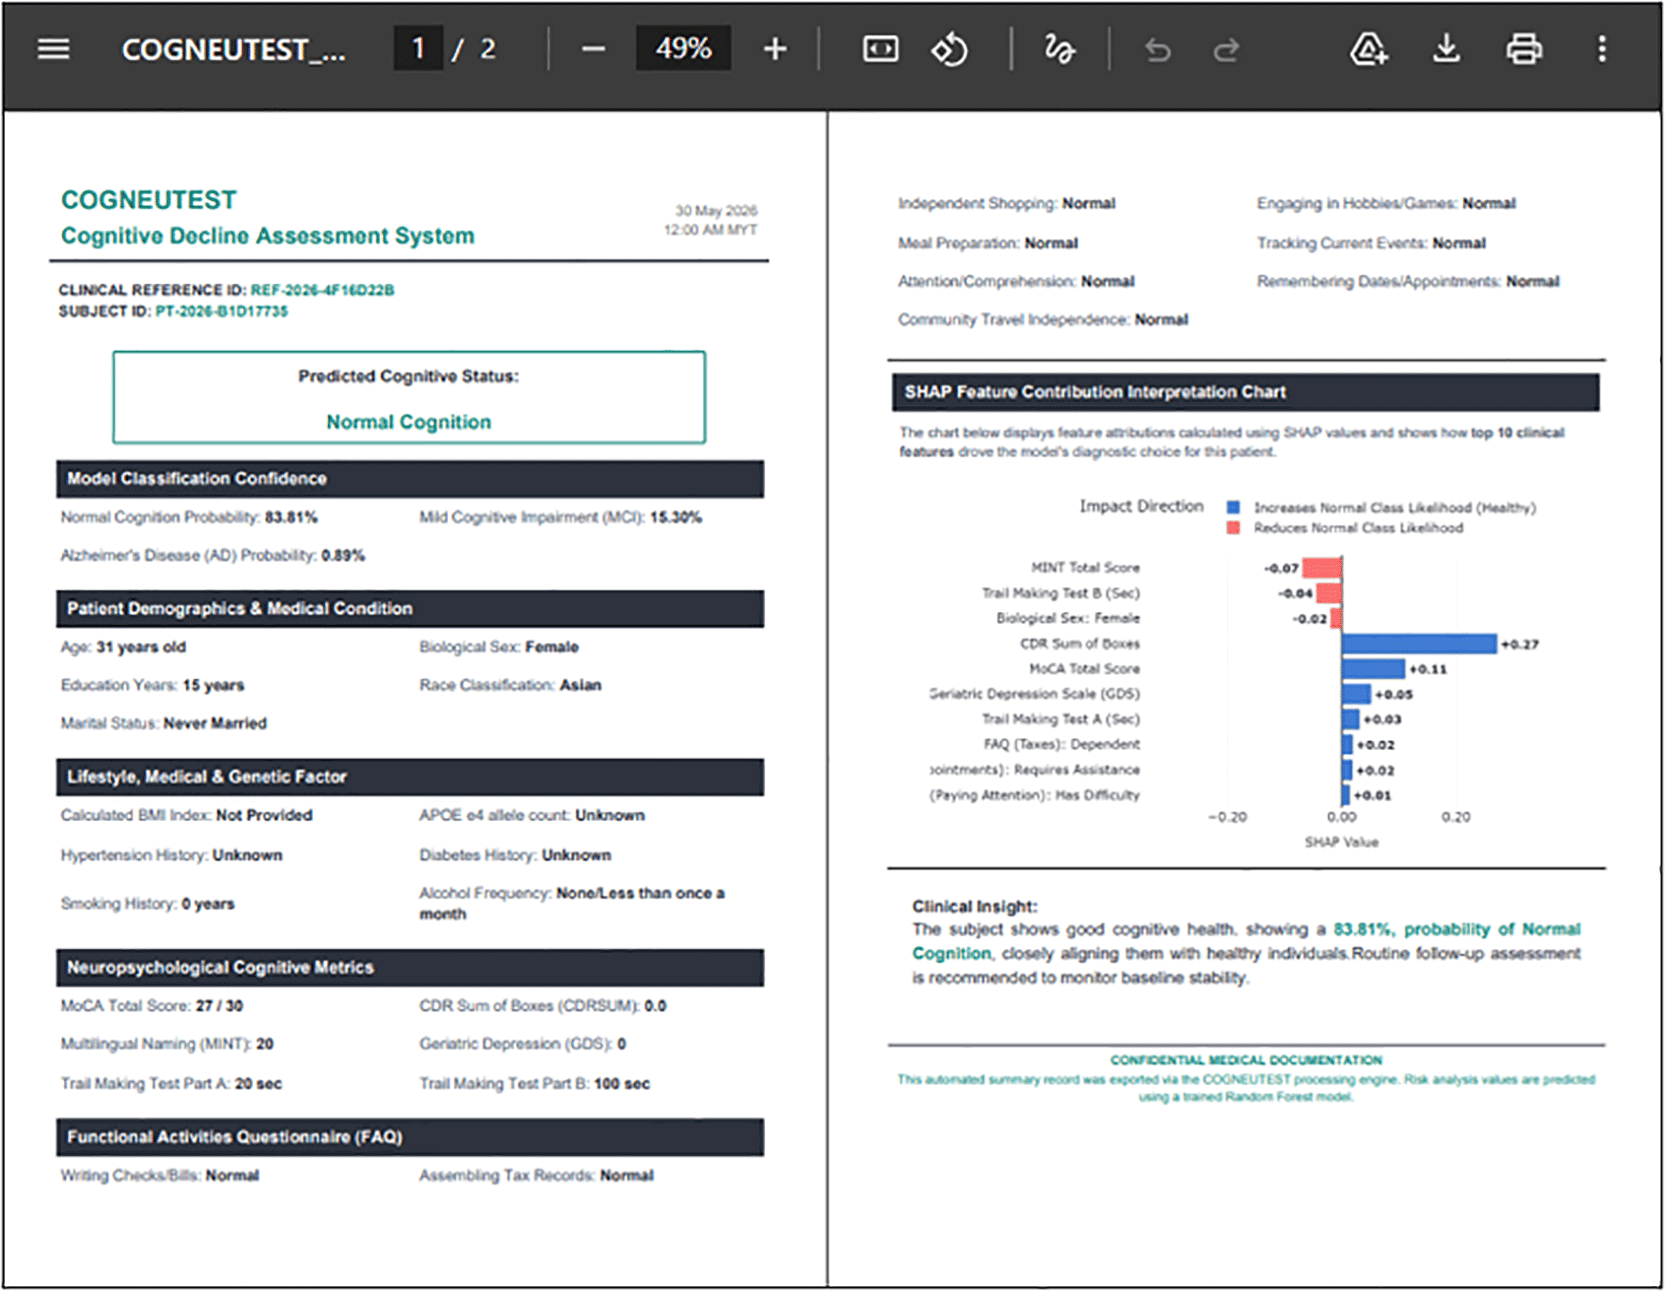
Figure 12 shows a document view of the auto-generated HTML-to-PDF summary report containing the input values, final classification confidence, SHAP contribution chart, and clinical insights.
The Dashboard page provides an overview of the distribution analytics of the clinical repository. As shown in Figure 13, the top of the interface layout features four metric cards that summarize database statistics, including Total Records, Total Patients, Total At-Risk Cases that combine MCI and AD Dementia predictions, and the overall At-Risk Proportion of the repository. A Distribution Analysis panel was implemented to help clinicians understand broader clinical trends across the clinic dataset.
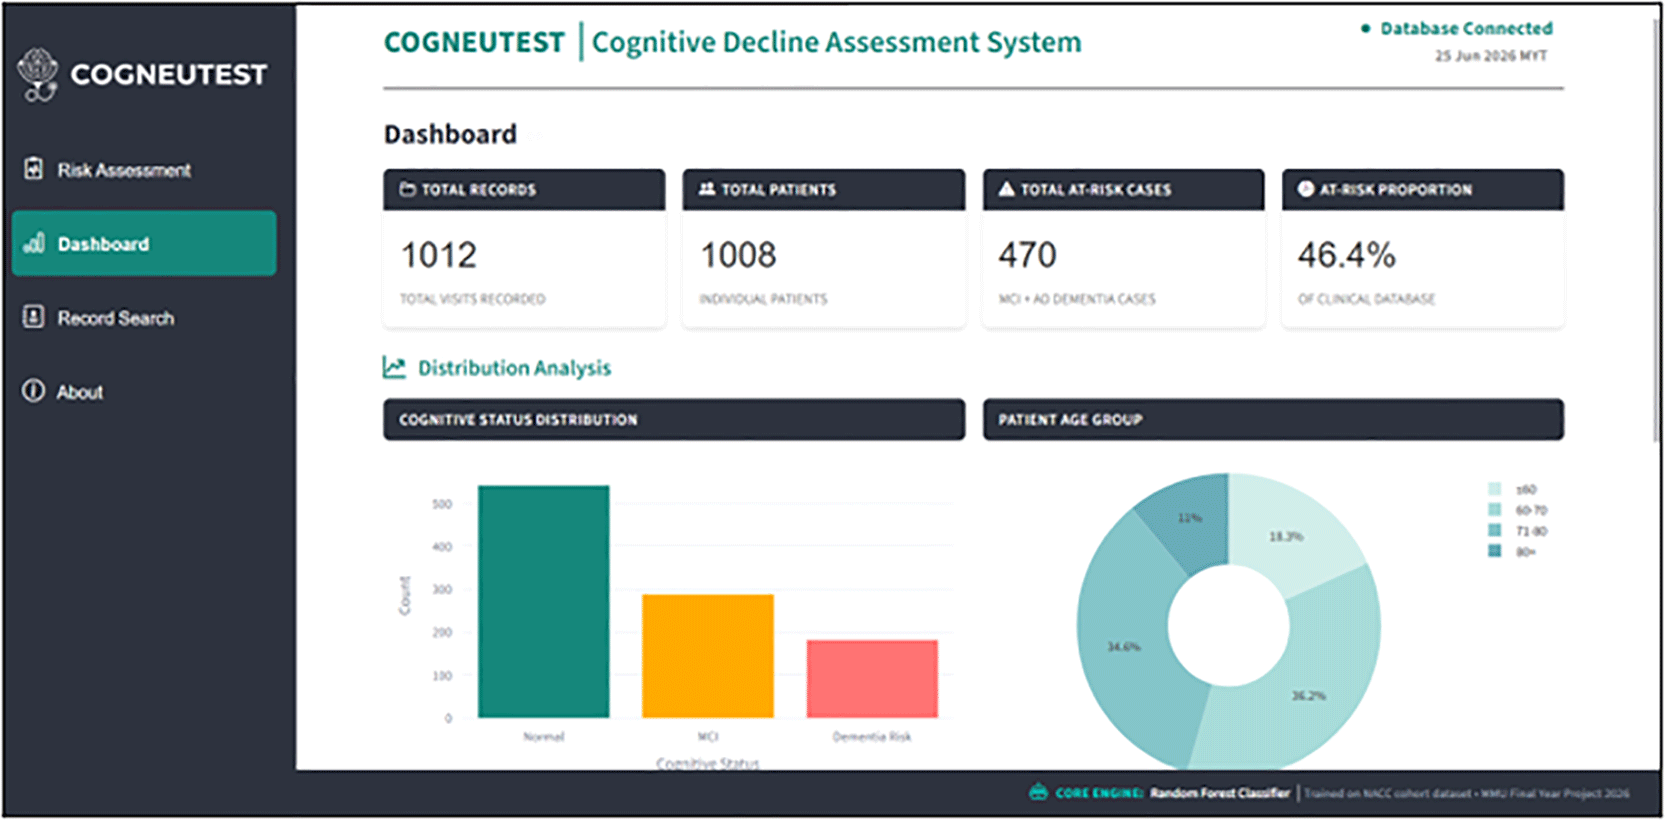
Figure 13 shows a screenshot of the dashboard page showing metric cards, a cognitive status distribution bar chart, and a patient age group donut chart.
The Record Search Page shown in Figure 14 serves as the local database directory for the clinic. It connects directly to SQLite storage. Clinicians can select any existing reference ID or patient ID from a searchable drop-down selection box to review their clinical timeline. The system pulls the corresponding rows from the database and displays them on the screen.
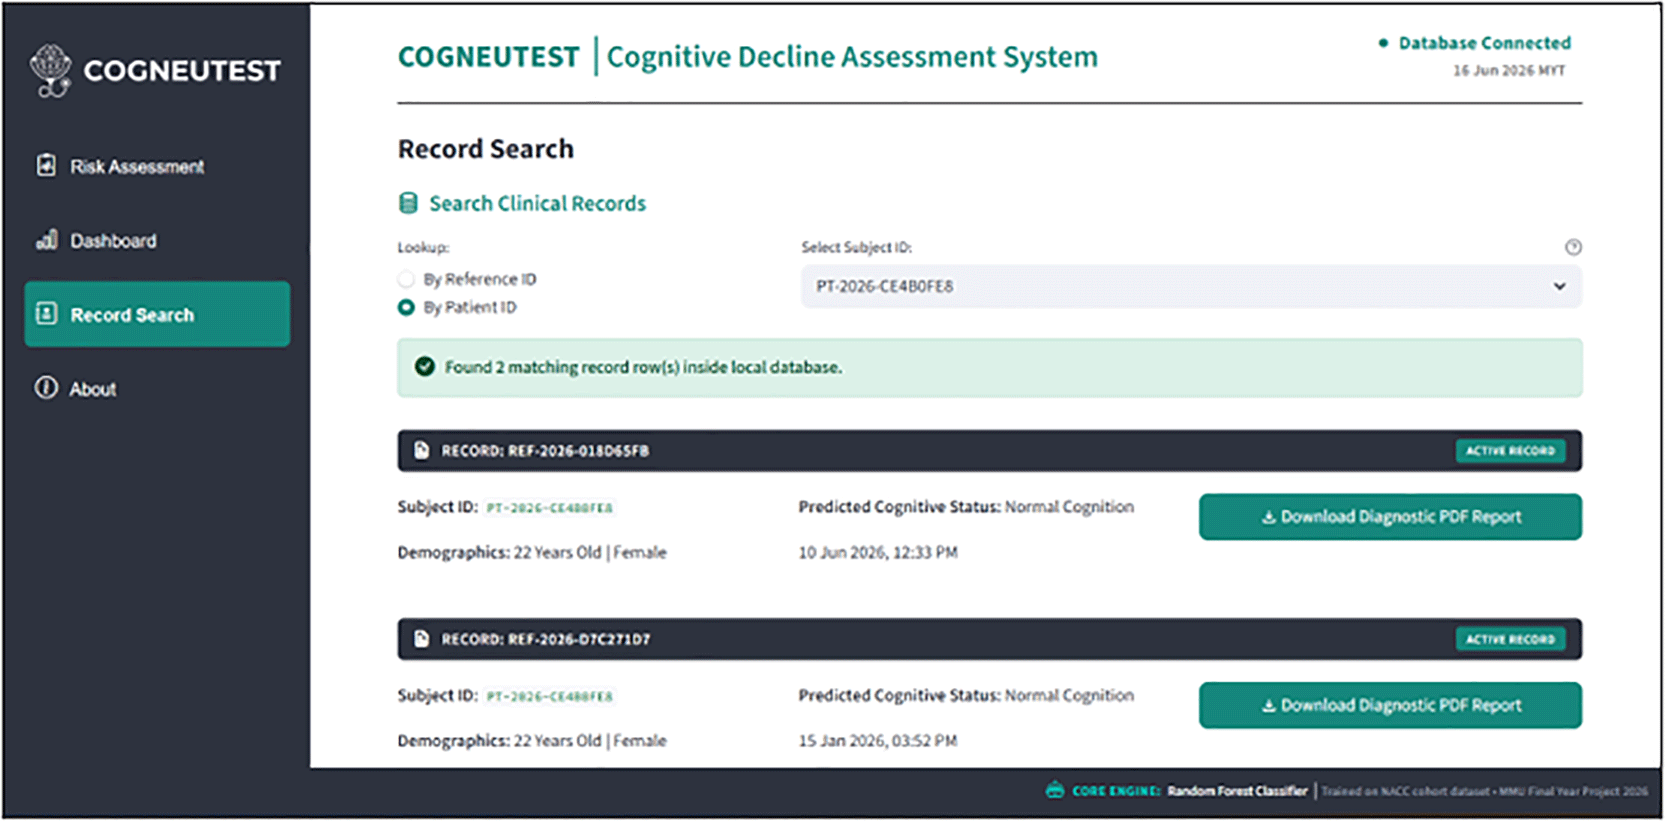
Figure 14 shows the database lookup page to allow users retrieve clinical records.
About page as shown in Figure 15 shows the background of the machine learning project. It provides explanations for the purpose of COGNEUTEST as a clinical decision-support system. This shows the use of a Random Forest model trained on the NACC dataset and the integration of SHAP for transparency. Moreover, it includes steps for performing the assessment. It also contains official email contact information and an embedded map widget that displays the university campus map.
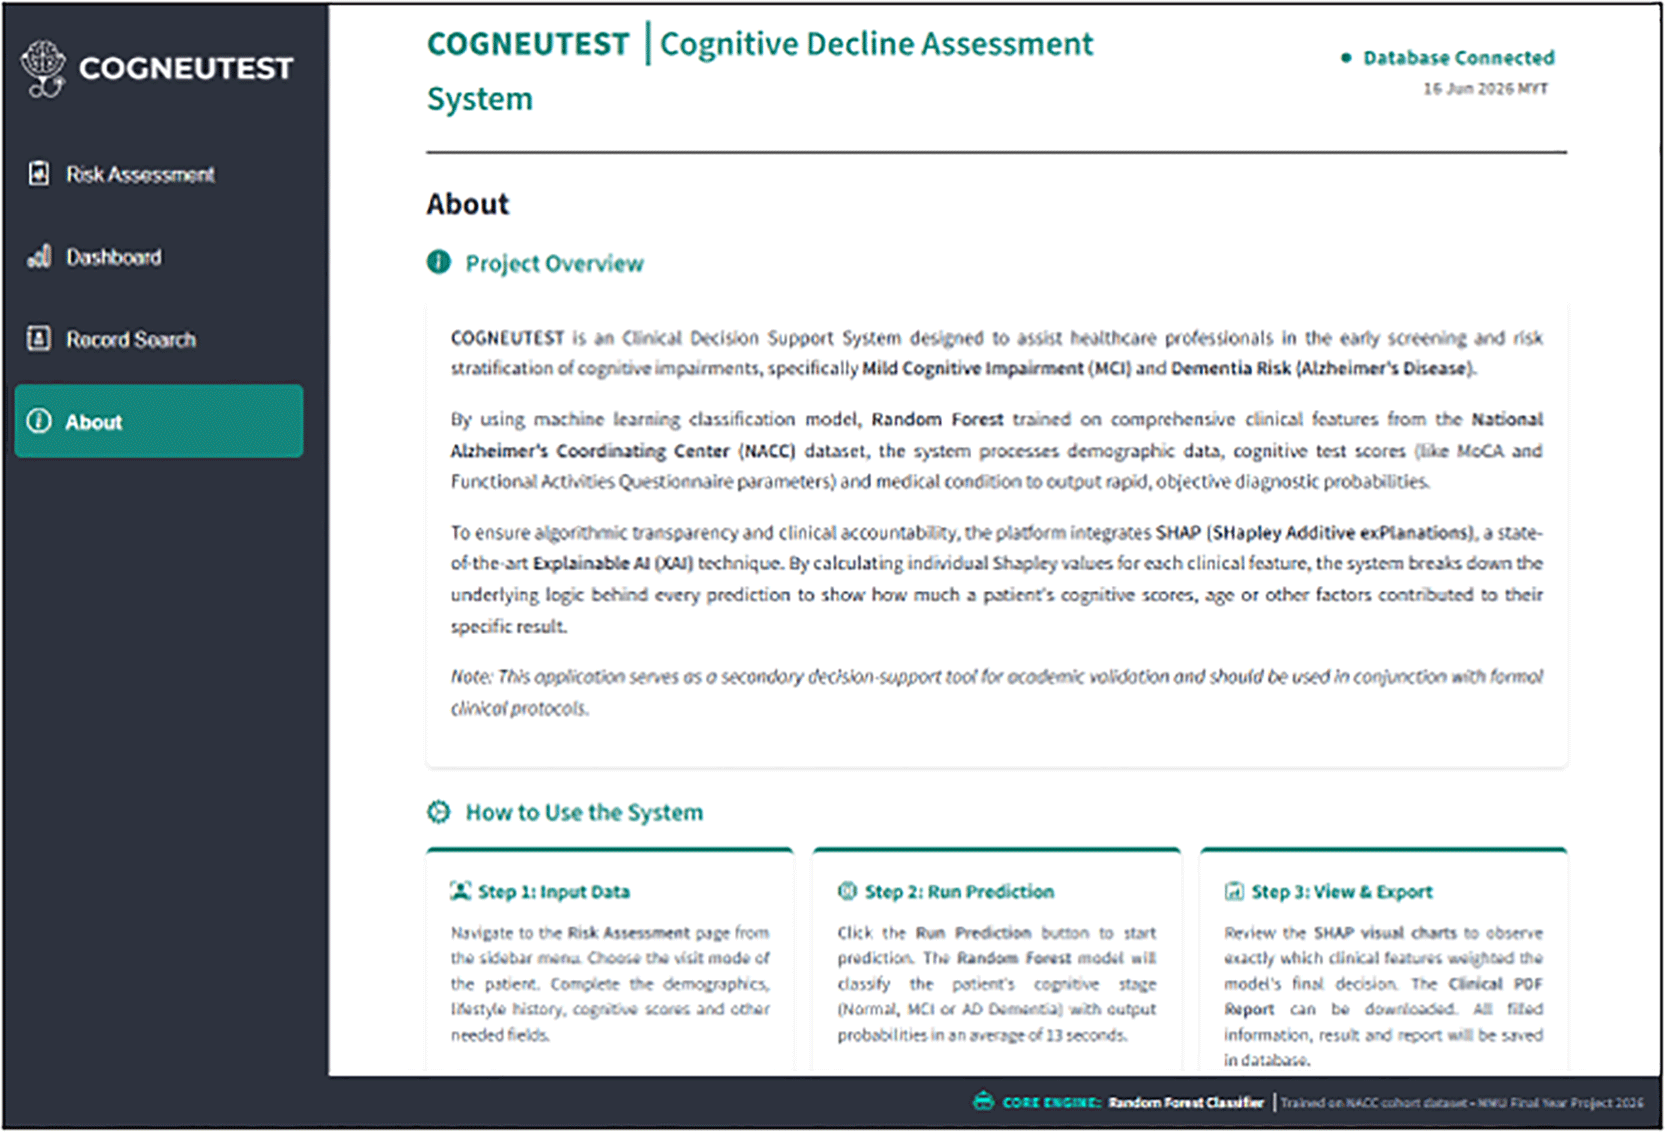
Figure 15 shows a screenshot of the page showing the project background, step-by-step instructions, and other academic institution support information.
A local database was created by using the SQLite database management tool. The database was connected directly to the system using a Python script. It has a structured table named patientrecords to store historical information every time a new assessment is completed. The detailed database structure, including the column names, data types, and descriptions, is presented in Table 10.
System evaluation was conducted to assess the operational efficiency, response times, and stability. For a clinical decision support system to be practical, data processing, machine learning classification, and reporting exports must be executed within a fast-paced medical workflow. The system was evaluated across three primary core operational aspects: prediction and PDF report generation time, database transaction efficiency, and PDF export speed, as shown in Table 11. Overall, the developed cognitive decline assessment system achieves high efficiency and responsiveness suitable for fast-paced medical environments. The system outputs results quickly by finishing the complex prediction and SHAP charts in just 13 s. Additionally, since looking up patient records and downloading reports takes less than 3 s, the system helps clinical staff work smoothly and efficiently. This proves that the system is ready for use in real-life clinics to support early cognitive decline checks.
Compared to the existing studies reviewed in the Literature Review section, this project demonstrated competitive and improved performance in early cognitive decline classification. The comparison focused on studies that applied classical machine learning methods to clinical or population-based datasets, as shown in Table 12.
Based on Table 12, many previous studies have focused on binary classification, such as normal versus impairment, normal versus dementia, or normal versus AD. For example, Nabavi et al. (2024), Oh et al. (2024) and De Palma et al. (2025) focused on binary classification using stacking ensemble or tree-based methods and reported AUC values below 0.85. Although these methods reduce task complexity, the proposed model performs better in terms of an AUC of 0.9534. This indicates that the methods developed in this study are more effective and can handle more challenging multiclass classification tasks.
Several studies have reported moderate performance. Shubar et al. (2024) applied an SVM to the NACC-UDS dataset and achieved an accuracy of 87.7% and an AUC of 0.869 for binary classification. Zhu et al. (2024) reported strong results using XGBoost, with an AUC of 0.9442 and an accuracy of 94.32% for normal versus MCI classification. Although their accuracy was slightly higher than that of the proposed method, their task was limited to binary classification and did not include an explainability analysis. This indicates that the proposed method provides a better balance between performance, task complexity, and interpretability.
Guillén & Frias-Martinez (2025) conducted a multiclass classification study using the NACC-UDS dataset and achieved an accuracy of 89.5% using an extra tree model. Although their accuracy was higher than that of the proposed method, their study did not report AUC values, which makes it difficult to evaluate the model’s ability to separate classes. In contrast, the proposed method achieved a high AUC of 0.9534, indicating a strong overall class discrimination.
Overall, the comparison shows that, although some existing studies achieve high accuracy in simplified or binary tasks, the proposed Random Forest model performs competitively in a more realistic multiclass classification task and offers SHAP explainability. This model development process showed the strength of the proposed approach in supporting the early detection of cognitive decline with both strong predictive performance and transparent decision-making.
In summary, this study developed COGNEUTEST, a web-based clinical decision support cognitive decline assessment system designed to assist healthcare professionals in early screening and risk classification of cognitive decline. This study fulfilled all of the objectives. Using an optimized Random Forest model trained on the NACC dataset with an accuracy of 86.05% and AUC of 0.9534, the system provides objective classification results across three classes: Normal Cognition, MCI and Alzheimer's disease dementia. The system focuses only on the 26 most influential clinical features, including basic patient details, lifestyle, genetic risk factors, and cognitive test scores. To address the Random’s "black box" limitation, SHAP was incorporated into the backend part. It can analyze how much a patient's cognitive test scores, demographics, medical conditions, and genetic and lifestyle factors contribute to their specific diagnosis results. Through evaluation, it was proven that it is highly efficient in processing complex data, running the predictive model and SHAP, as well as generating PDF reports in an average of 13 s, as well as database operations executed in under 1 s. This system successfully achieved its goal of providing functional, objective predictions, and explainable features for clinical environments.
Acknowledging the limitations of this study are critical. The proposed model was trained and evaluated using the NACC dataset only. Although the NACC dataset is comprehensive and widely used in cognitive decline research, evaluating only a single dataset may make it difficult to handle and predict patients from different places. Furthermore, although the Random Forest model achieved a strong performance, the study relied on classical machine learning algorithms rather than deep learning or hybrid approaches. Classical machine learning was chosen because of its computational efficiency and suitability for tabular clinical data, but more complex models such as deep or hybrid architectures may capture more complicated subtle patterns and potentially achieve higher predictive performance. However, deep learning models are often uninterpretable and computationally more expensive than classical machine-learning models. Finally, the feature importance analysis revealed that the model relies heavily on FAQ variables such as the ability to handle taxes, bills, and shopping. Although they are highly predictive, these measures are subjective and strictly dependent on the availability and reliability of an informant. In a real clinic, if a patient comes alone without a caregiver, the model's accuracy could drop because it did not have answers.
The findings suggest that further refinement of the AI-driven assessment system should focus on solving its limitations to make it more useful for different medical settings. Future work should involve testing the Random Forest model on separate databases, such as clinical records from local hospitals, to ensure that the tool can provide accurate estimates for patients from different backgrounds. Additionally, future work could explore deep learning models to check if they can capture trickier, hidden patterns in brain data. Lastly, creating a self-test portal built around easy lifestyle questionnaires could help individuals identify risk signs early and encourage them to visit a doctor for a full checkup before their brain condition worsens.
This study used clinical data obtained from the National Alzheimer’s Coordinating Center (NACC). The NACC dataset comprises data collected from the NIA-funded Alzheimer's Disease Research Centers (ADRCs) across the United States. The data used in this study were fully anonymized by the NACC before researcher access was obtained. Hence, this study did not involve direct interaction with human subjects.
The dataset used in this study cannot be directly distributed by the authors because of the data usage agreement enforced by the National Alzheimer’s Coordinating Center (NACC) to protect participants’ privacy. However, this can be requested directly by qualified researchers for research purposes. To submit a data request or more information, please visit the NACC website at https://naccdata.org/. Approval was granted upon submission of a valid data request form and compliance with the NACC Data Use Agreement.
No extended data such as questionnaires, consent forms, or interview guides were generated for this study. This study used a publicly available dataset, and all the data processing steps are described in the Methods section.
The scope of this study does not include clinical trials, animal research, observational studies, or qualitative research. Therefore, reporting guidelines such as CONSORT, ARRIVE, STROBE, COREQ, and SRQR are not applicable.
The NACC database was funded by NIA/NIH Grant U24 AG072122. NACC data are contributed by the NIA-funded ADRCs: P30 AG062429 (PI James Brewer, MD, PhD), P30 AG066468 (PI Oscar Lopez, MD), P30 AG062421 (PI Bradley Hyman, MD, PhD), P30 AG066509 (PI Thomas Grabowski, MD), P30 AG066514 (PI Mary Sano, PhD), P30 AG066530 (PI Helena Chui, MD), P30 AG066507 (PI Marilyn Albert, PhD), P30 AG066444 (PI David Holtzman, MD), P30 AG066518 (PI Lisa Silbert, MD, MCR), P30 AG066512 (PI Thomas Wisniewski, MD), P30 AG066462 (PI Scott Small, MD), P30 AG072979 (PI David Wolk, MD), P30 AG072972 (PI Charles DeCarli, MD), P30 AG072976 (PI Andrew Saykin, PsyD), P30 AG072975 (PI Julie A. Schneider, MD, MS), P30 AG072978 (PI Ann McKee, MD), P30 AG072977 (PI Robert Vassar, PhD), P30 AG066519 (PI Frank LaFerla, PhD), P30 AG062677 (PI Ronald Petersen, MD, PhD), P30 AG079280 (PI Jessica Langbaum, PhD), P30 AG062422 (PI Gil Rabinovici, MD), P30 AG066511 (PI Allan Levey, MD, PhD), P30 AG072946 (PI Linda Van Eldik, PhD), P30 AG062715 (PI Sanjay Asthana, MD, FRCP), P30 AG072973 (PI Russell Swerdlow, MD), P30 AG066506 (PI Glenn Smith, PhD, ABPP), P30 AG066508 (PI Stephen Strittmatter, MD, PhD), P30 AG066515 (PI Victor Henderson, MD, MS), P30 AG072947 (PI Suzanne Craft, PhD), P30 AG072931 (PI Henry Paulson, MD, PhD), P30 AG066546 (PI Sudha Seshadri, MD), P30 AG086401 (PI Erik Roberson, MD, PhD), P30 AG086404 (PI Gary Rosenberg, MD), P20 AG068082 (PI Angela Jefferson, PhD), P30 AG072958 (PI Heather Whitson, MD), P30 AG072959 (PI James Leverenz, MD).
The author(s) declared that no grants were involved in supporting this work.
© 2026 Tan YS and Lew SL. This is an open access article distributed under the terms of the Creative Commons Attribution License, which permits unrestricted use, distribution, and reproduction in any medium, provided the original work is properly cited.
Current Reviewer Status:
AWAITING PEER REVIEW
AWAITING PEER REVIEW
?
Key to Reviewer Statuses VIEW HIDE
ApprovedThe paper is scientifically sound in its current form and only minor, if any, improvements are suggested
Approved with reservations A number of small changes, sometimes more significant revisions are required to address specific details and improve the papers academic merit.
Not approvedFundamental flaws in the paper seriously undermine the findings and conclusions