Просмотр новости
Найдите то, что Вас интересует
 Спутники
 РН
РН SpaceX
 Роскосмос
 NASA
NASA
СпутникиРНSpaceXРоскосмосNASARoute logs to ClickHouse with Observability Pipelines and search them from the Datadog Log Explorer.

Andy Lihani
As teams scale AI and agentic workloads, log volumes can grow fast. That growth can force teams into a difficult trade-off: Keep logs searchable in their existing workflows, or store them cost-effectively for longer periods. For teams that rely on logs during incident response, compliance reviews, and long-running investigations, losing either affordability or searchability can slow down troubleshooting.
Datadog and ClickHouse are partnering to help remove that trade-off. Two new capabilities, now in Preview, let you route high-volume logs to ClickHouse through Datadog Observability Pipelines and search those logs directly from the Datadog Log Explorer without re-ingesting them into Datadog.
First, we’ll explain what ClickHouse is and why it is useful for high-volume observability data. Then we’ll describe how the integration enables you to:
What is ClickHouse?ClickHouse is a high-performance, open source columnar database originally built for real-time analytics at massive scale. For observability use cases, ClickHouse supports sub-second analysis across petabytes of logs, metrics, traces, and events. It also helps reduce storage costs through high compression and separation of storage and compute.
ClickHouse is well suited for high-cardinality telemetry data, which makes it a strong fit for organizations managing large and fast-growing observability datasets. Organizations including OpenAI, DoorDash, Anthropic, and Shopify use ClickHouse as an observability database for large-scale analytics.
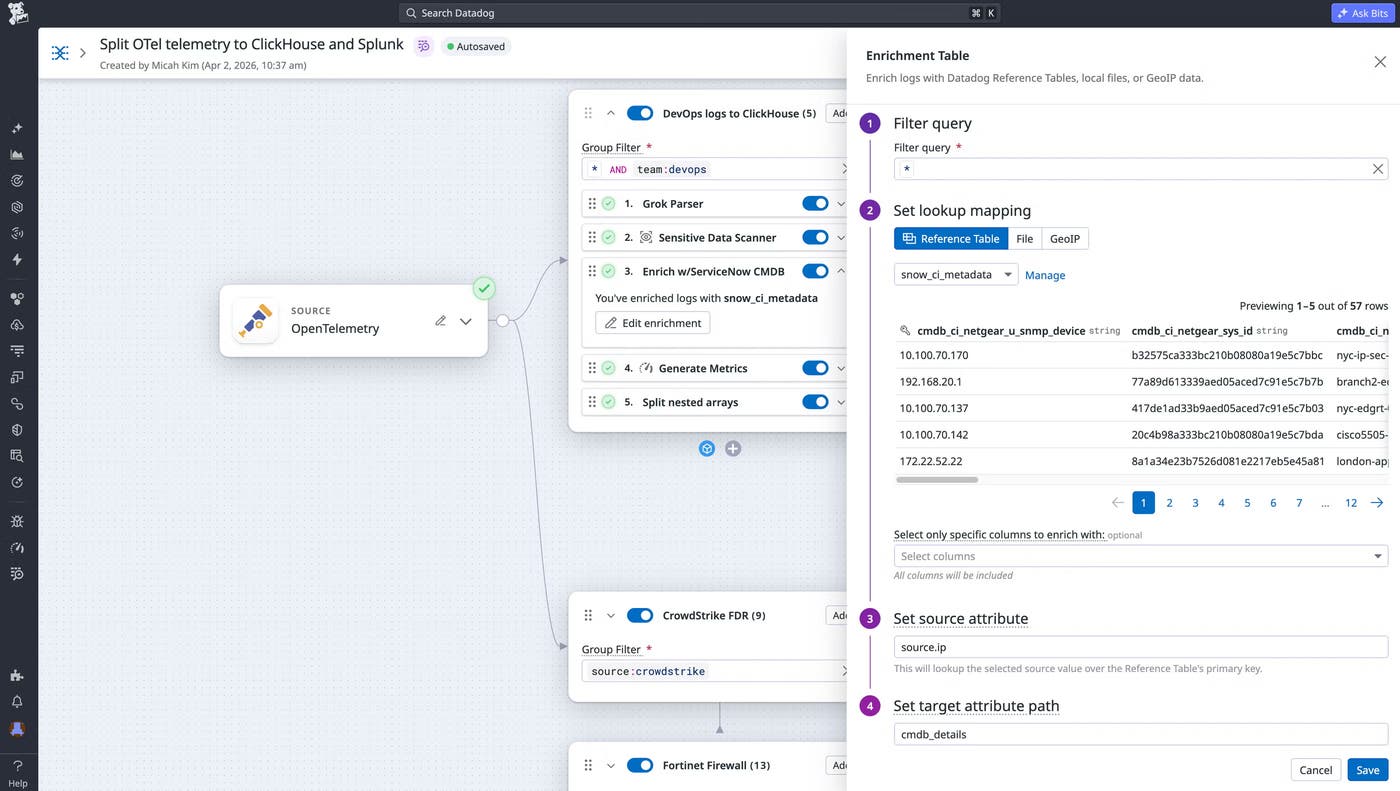
Route logs to ClickHouse with Observability PipelinesWith a native ClickHouse destination for Datadog Observability Pipelines, you can send application and infrastructure logs to ClickHouse with in-stream parsing, enrichment, and redaction. This helps high-volume data land in a cost-efficient store already shaped for querying.
You can decide which logs should go where from a single pipeline. For example, you might route high-value logs to Datadog for real-time monitoring and send high-volume logs, or logs that require longer retention for compliance reasons, to ClickHouse. Observability Pipelines gives you a vendor-agnostic way to control these routing decisions before logs reach their destinations.
With Federated Logs, you can query logs stored in ClickHouse directly from the Datadog Log Explorer without re-ingesting the data into Datadog. This gives teams one search experience across Datadog-managed and ClickHouse-stored logs.
This approach helps teams retain higher volumes of logs for longer periods without sampling, while still investigating them alongside the rest of their observability data. Because the data stays in ClickHouse, teams can query it in place instead of duplicating logs across systems. And during an incident, engineers can move between Datadog and ClickHouse data without switching tools or rebuilding queries in a separate UI.
Get started with Datadog and ClickHouseThe native ClickHouse destination for Observability Pipelines and federated search for ClickHouse logs are now available in Preview. Together, these capabilities help teams store high-volume logs cost-effectively in ClickHouse while keeping those logs searchable from the Datadog Log Explorer.
To get started, read the ClickHouse integration documentation or request access to the Federated Logs Preview. To learn more about routing telemetry data with Observability Pipelines, read the Observability Pipelines documentation. If you’re new to Datadog, you can sign up for a 14-day free trial.
| # | Наименование новости | Тональность | Информативность | Дата публикации |
|---|---|---|---|---|
| 1 | Investigate logs across your entire stack with Federated Logs | 0 | 5.34 | 09-06-2026 |
| 2 | Monitor OVHcloud with Datadog | 0 | 12.4 | 09-06-2026 |
| 3 | Reduce CDN log costs with searchable archives | 0 | 14.49 | 26-06-2026 |
| 4 | Monitor Scaleway with Datadog | 0 | 6.4 | 09-06-2026 |
| 5 | Use OpenTelemetry-native observability with Datadog from ingestion to investigation | 0 | 17.47 | 20-07-2026 |
| 6 | Monitor Nebius AI Cloud with Datadog | 0 | 8.88 | 09-06-2026 |
| 7 | Unified observability for Alibaba Cloud with Datadog | 0 | 4.44 | 28-05-2026 |
| 8 | Maintain observability during cloud outages with Datadog Disaster Recovery | 0 | 6.69 | 09-06-2026 |
| 9 | Normalize security logs to Google SecOps UDM with Observability Pipelines | 0 | 6.4 | 27-07-2026 |
| 10 | Using Evaluation Frameworks with Agent Observability | 0 | 7.74 | 22-06-2026 |